
By Scott Ikard 1, and Andrew Teeple1
1U.S. Geological Survey, Oklahoma-Texas Water Science Center, Austin, Texas, USA
Emails: sikard@usgs.gov; apteeple@usgs.gov
Published 09/16/2021
Abstract
The Rio Grande is the primary source of recharge to the Mesilla Basin/Conejos-Médanos aquifer system (“Mesilla Basin aquifer system”) in the Mesilla Valley of New Mexico and Texas. The Mesilla Basin aquifer system is the primary source of water supply to several large cities along the United States–Mexico border. Identifying gaining and losing reaches of the Rio Grande in the Mesilla Valley is therefore critical for managing the quality and quantity of surface and groundwater-resources available to stakeholders in the Mesilla Valley and downstream. A Waterborne gradient Self-Potential (WaSP) logging survey was completed in the Rio Grande across the Mesilla Valley between June 26 and July 2, 2020 to identify reaches where surface-water gains and losses were occurring by interpreting an estimate of the streaming-potential component of the electrostatic field in the river, measured during bank-full flow. The WaSP survey, completed as part of the Transboundary Aquifer Assessment Program, began at Leasburg Dam State Park, New Mexico near the northern terminus of the Mesilla Valley and ended ~72 kilometers (km) downstream in Canutillo, Texas. Electric potential data indicated a net losing condition for ~32 km between Leasburg Dam and Mesilla Diversion Dam in New Mexico, with one 200-m long reach showing a localized gaining condition. Downstream from Mesilla Diversion Dam, electric-potential data indicated a neutral-to-mild gaining condition for 12-km that transitioned to a mild-to-moderate gaining condition between 12 and ~22 km from the dam before transitioning back to a losing condition along the remaining 18 km of the survey reach. The interpreted gaining and losing reaches are substantiated by potentiometric surface mapping in hydrostratigraphic units of the Mesilla Basin aquifer system between 2010 and 2011 and streamflow gains and losses quantified from annual streamflow gaging at 16 stations along the survey reach between 1988 and 1998 and between 2004 and 2013. The gaining and losing reaches of the Rio Grande in the Mesilla Valley, interpreted from electric potential data, compare notably well with streamflow gains and losses quantified at 16 locations along the 72-km long survey reach.
Introduction
In 2006, the United States (U.S.)–Mexico Transboundary Aquifer Assessment Act (Public Law 109-448, herein referred to as the “Act”) authorized collaboration between the U.S. and Mexico in conducting hydrogeologic characterization, mapping, and groundwater-flow modeling for priority transboundary aquifers that are internationally shared (Alley, 2013; Teeple, 2017). Priority transboundary aquifers were designated along the U.S–Mexico border region based on: (1) the proximity of a transboundary aquifer to metropolitan areas with high population density, (2) the extent to which an aquifer would be utilized as a source of water supply, and (3) the susceptibility of an aquifer to anthropogenic or environmental contamination. Based on these criteria, the Mesilla Basin/Conejos-Médanos aquifer system (hereinafter referred to as the Mesilla Basin aquifer) was designated a priority transboundary aquifer because the Mesilla basin is hydraulically connected to the Conejos-Médanos aquifer in Chihuahua Mexico and there are no natural barriers to inhibit groundwater flow across the border (Teeple, 2017).
There is active litigation and adjudication of water rights in several basins of the border region (Alley, 2013). Adjudication is often complicated by disparate policy frameworks for groundwater and surface-water resources even though they are often interdependent and function as a single resource (Winter et al., 1999). Among the unique policy and management-related challenges for these resources are the needs to develop a shared definition of aquifer boundaries and develop methods to assess whether the aquifers on both sides of the border are indeed hydraulically connected and internationally shared. These challenges are exacerbated by uncertainty about the interdependence between transboundary aquifers and regional surface-water resources, which is also necessary to understand to adequately manage and sustain water-resources in the border region.
This article summarizes the methods and findings published by Ikard et al., (2021a) in contribution to the fundamental science objectives outlined by the Act, which include establishing relevant hydrogeological, geochemical, and geophysical field studies that integrate ongoing monitoring and metering and developing and enhancing geographic information systems databases pertaining to priority transboundary aquifers. The Waterborne gradient Self-Potential (WaSP) logging method of geophysical prospecting was applied to study regional-scale groundwater and surface-water exchanges between the Rio Grande and the Mesilla Basin aquifer by mapping gaining and losing reaches of the Rio Grande in the Mesilla Valley. WaSP logging data were processed into electric potential and interpreted in the context of streaming potential following the assumption that streaming potential attributed to surface-water gain and loss through the riverbed and floodplain was the predominant contribution to the electric-potential field in the river, in accordance with numerical modeling of Ikard et al., (2018) and Ikard et al., (2021b). Interpretations of surface-water gain and loss from electric potential were supported by surface-water temperature and conductivity logging along the surveyed reach and hydraulic and geophysical datasets presented by Teeple (2017) that consisted of: (1) profiles of resistivity beneath the Rio Grande channel to depths of 50 meters, (2) relative median gains and losses in streamflow quantified at 16 locations along the survey reach by annual streamflow gaging between 1988 and 1998 and between 2004 and 2013 (Crilley et al., 2013), and (3) vertical hydraulic gradients beneath the Rio Grande inferred by potentiometric surface mapping in wells completed in the Rio Grande alluvium and members of the upper part of the Santa Fe group (hereinafter referred to as the “upper Santa Fe Group”) of the Mesilla Basin aquifer between November 2010 and April 2011 (Teeple, 2017).
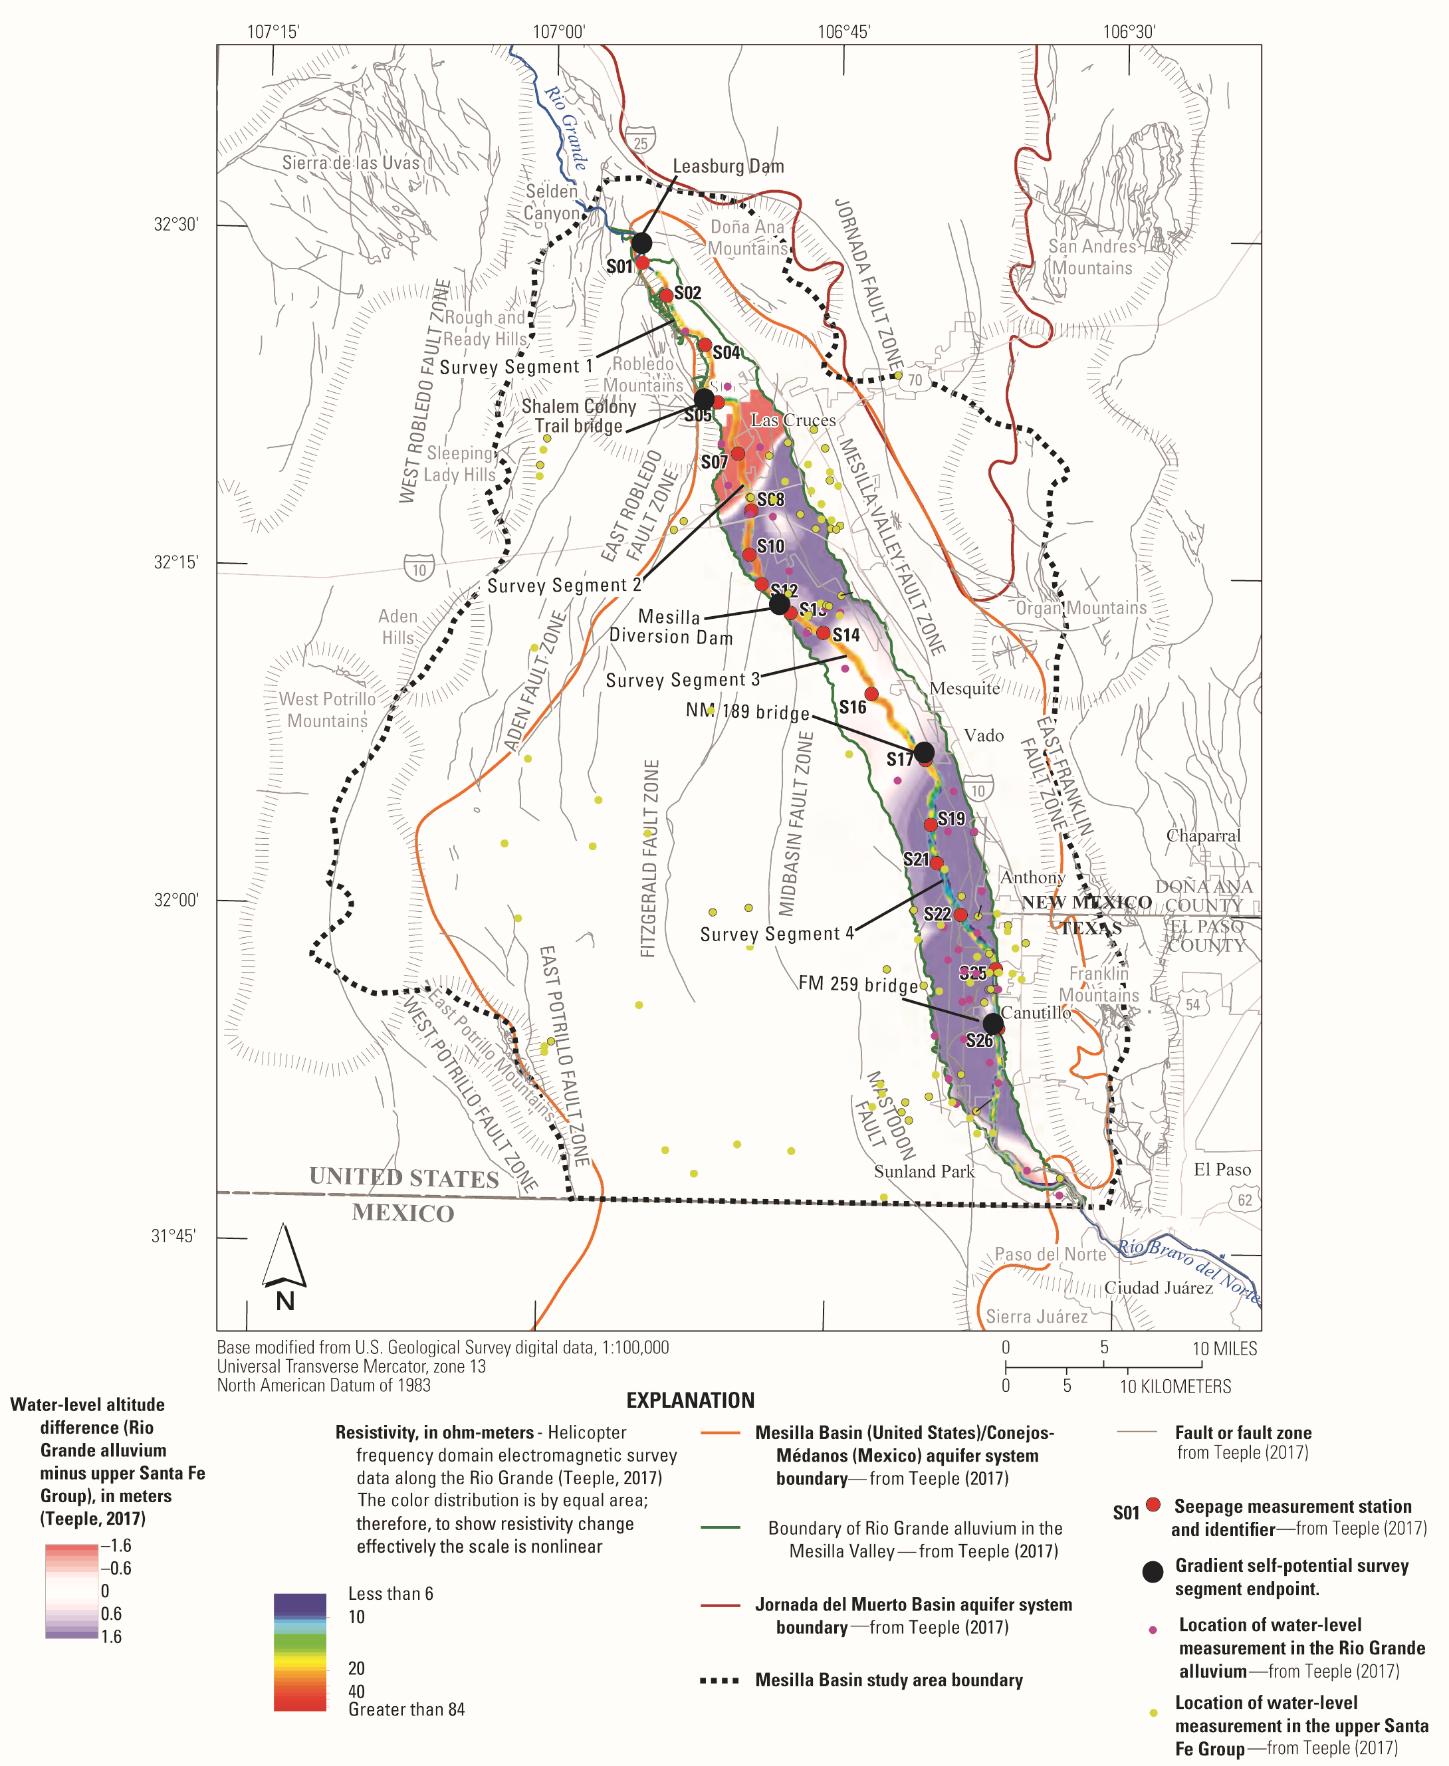
Description of the Study Area
Groundwater and surface-water connectivity in the Mesilla Valley is complex (Fig. 1). Horizontal hydraulic gradient maps published by Teeple (2017) indicated that groundwater within the Mesilla Basin aquifer is generally unconfined and flows southward longitudinal to the Rio Grande. Leasburg and Mesilla Diversion Dams, positioned along the surveyed reach in the Mesilla Valley, both steepen the local hydraulic gradient from upstream to downstream and potentially alter regional horizontal and vertical hydraulic gradients and groundwater-flow patterns.
Vertical hydraulic gradients beneath the Rio Grande vary substantially across the Mesilla Valley from upstream to downstream. Figure 1 shows a comparison of differences in 2010–11 water-levels in the Rio Grande alluvium and upper Santa Fe Group with the sub-channel resistivity at a depth of 30.5 meters below the land surface. The 2010–11 water-level altitudes in the Rio Grande alluvium were higher than the water-level altitudes in the upper Santa Fe Group throughout most of the Mesilla Valley (blue sections corresponding to water-level differences greater than 0 ft) indicating the vertical hydraulic gradient was oriented downward and surface-water losses were likely to occur in locations where the differences were greater than 0 (e.g., at streamflow gaging stations S08–S14 and downstream of station S17). Reductions (white sections, e.g., streamflow gaging stations S14–S17) and reversals (red sections, e.g., streamflow gaging stations S05–S08) of the vertical hydraulic gradient were also mapped by Teeple (2017).
Annual seepage investigations were done in the Rio Grande by the U.S. Geological Survey (Crilley et al., 2013) between 1988 and 1998, and between 2004 and 2013. The locations of streamflow gaging stations corresponding to seepage investigations of the Rio Grande are shown in Figure 1 by the red dots (S02–S26). During each annual seepage investigation, streamflow gaging was performed at streamflow gaging stations over a period of 1–2 days during low-flow conditions in the non-irrigation season (February). Net seepage gains or losses were quantified at each station by subtracting the discharge measured at each station from the discharge measured at the closest upstream station, and then subtracting inflows to the Rio Grande within the segment bounded by the two stations.
Methods
The WaSP survey was completed between June 26 and July 2, 2020 during peak releases of surface-water from Elephant Butte and Caballo Dams upstream from the survey reach. The purpose of the survey was to produce a continuous profile of electric potential in the Rio Grande during a bank-full flow condition—the maximum amount of discharge that a river channel can carry without overflowing onto the floodplain—and to interpret the data in the context of surface-water gains and losses by incorporating surface-water temperature and conductivity measurements, sub-channel resistivity (Fig. 1), inferred vertical hydraulic gradients (Fig. 1), and median values of gain and loss in streamflow at each streamflow gaging station along the survey reach, determined from 21 annual seepage investigations (Section 4).
The WaSP survey was completed during bank-full flow so that vertical hydraulic gradients in losing segments would be optimized, better enabling their identification. The survey began at Leasburg Dam in Leasburg Dam State Park, New Mexico (NM), and ended near the Farm-to-Market (FM) 259 bridge in Canutillo, Texas (TX) approximately 72 km downstream. The survey reach was subdivided into four 15- to 25-km long segments that were surveyed individually and combined during data processing into two longer reaches for interpretation (Figs. 1–2); one between Leasburg dam and Mesilla Diversion Dam, and a second downstream from Mesilla Diversion Dam to Canutillo, TX. The first survey-segment began at Leasburg Dam and ended a few meters downstream from the Shalem Colony Trail bridge in Las Cruces, NM. The second began a few meters downstream from the Shalem Colony Trail bridge and ended about 160 meters upstream from the Mesilla Diversion Dam between Mesilla and Mesquite, NM. The third began a few meters downstream from the Mesilla Diversion Dam and ended a few meters downstream from the NM State Road 189 bridge in Vado, NM, and the fourth began a few meters downstream from the NM State Road 189 bridge and ended a few meters downstream from the FM 259 bridge in Canutillo, TX.
All WaSP measurements were made from a kayak (Fig. 2a) along the left (east) bank of the Rio Grande by positioning sensors into the surface water through the drain ports in the kayak hull. Two freshwater-submersible, non-polarizing copper-sulfate electrodes were used to create a 0.5-m long electric dipole, which was oriented with the reference electrode upstream from the potential electrode. An Onset HOBO temperature and conductivity logger was placed into the Rio Grande surface-water through a drain port adjacent to the reference SP electrode. GPS, power, and data-logging equipment were transported onboard the kayak and the geospatial coordinates of the dipole midpoint were logged with a Trimble DSM232 differential GPS with horizontal accuracy between 5 and 10 cm.
The raw WaSP data measured in the Rio Grande consisted of voltages between the reference and potential electrodes of the dipole, which were logged every second as the dipole floated downstream in the river. The raw data, corrected for transient electrode drift, are shown in Figure 2b (black data) and denoted as ∆V (in units of mV). The WaSP data were assumed to contain large and small-scale spatial components; a large-scale (low-frequency spatial variation) “L” component, ∆VL (Fig. 2b, red), a small-scale (high-frequency spatial variation) “H” component ∆VH (not shown), and some unknown level of noise, ∆VN, referred to herein as the “N” component (not shown). The combination of the H and N components, considered the “HN” component, is an intermediate step in the data-processing and is shown in Figure 2c. The WaSP data were partitioned into each of these components and each component was numerically integrated into a profile of electrical potential (Ikard et al., 2018; Ikard et al., 2021a).

Results and Discussion
Figure 3 depicts the median gain or loss (blue data) at seepage-measurement stations along the survey reach of the Rio Grande shown in Figure 1. The data are plotted relative to the adjacent (upstream) measurement station (S04 relative to S02, etc.) and compared to 2010–11 water-level differences between the Rio Grande alluvium and upper part of the Santa Fe Group, indicated by the color-shading (see also Fig. 1), and the H-component electric-potential (Fig.3, black data) produced by the numerical integration of the H component of drift-corrected data shown in Figure 2c. The double vertical axes in Figure 3 are aligned at 0 millivolts (black data, right vertical axis) and 0 cubic meters per second (blue data, left vertical axis) such that everything above the horizontal dashed red line represents a surface-water gain, and everything below represents a surface-water loss, for both data series. Reductions of relative median gain or loss in streamflow between two adjacent stations represent net losses along the survey segments and increases represent net gains, whereas negative electric potential is interpreted as representative of a net losing condition and positive electric potential is interpreted as representative of a net gaining condition.
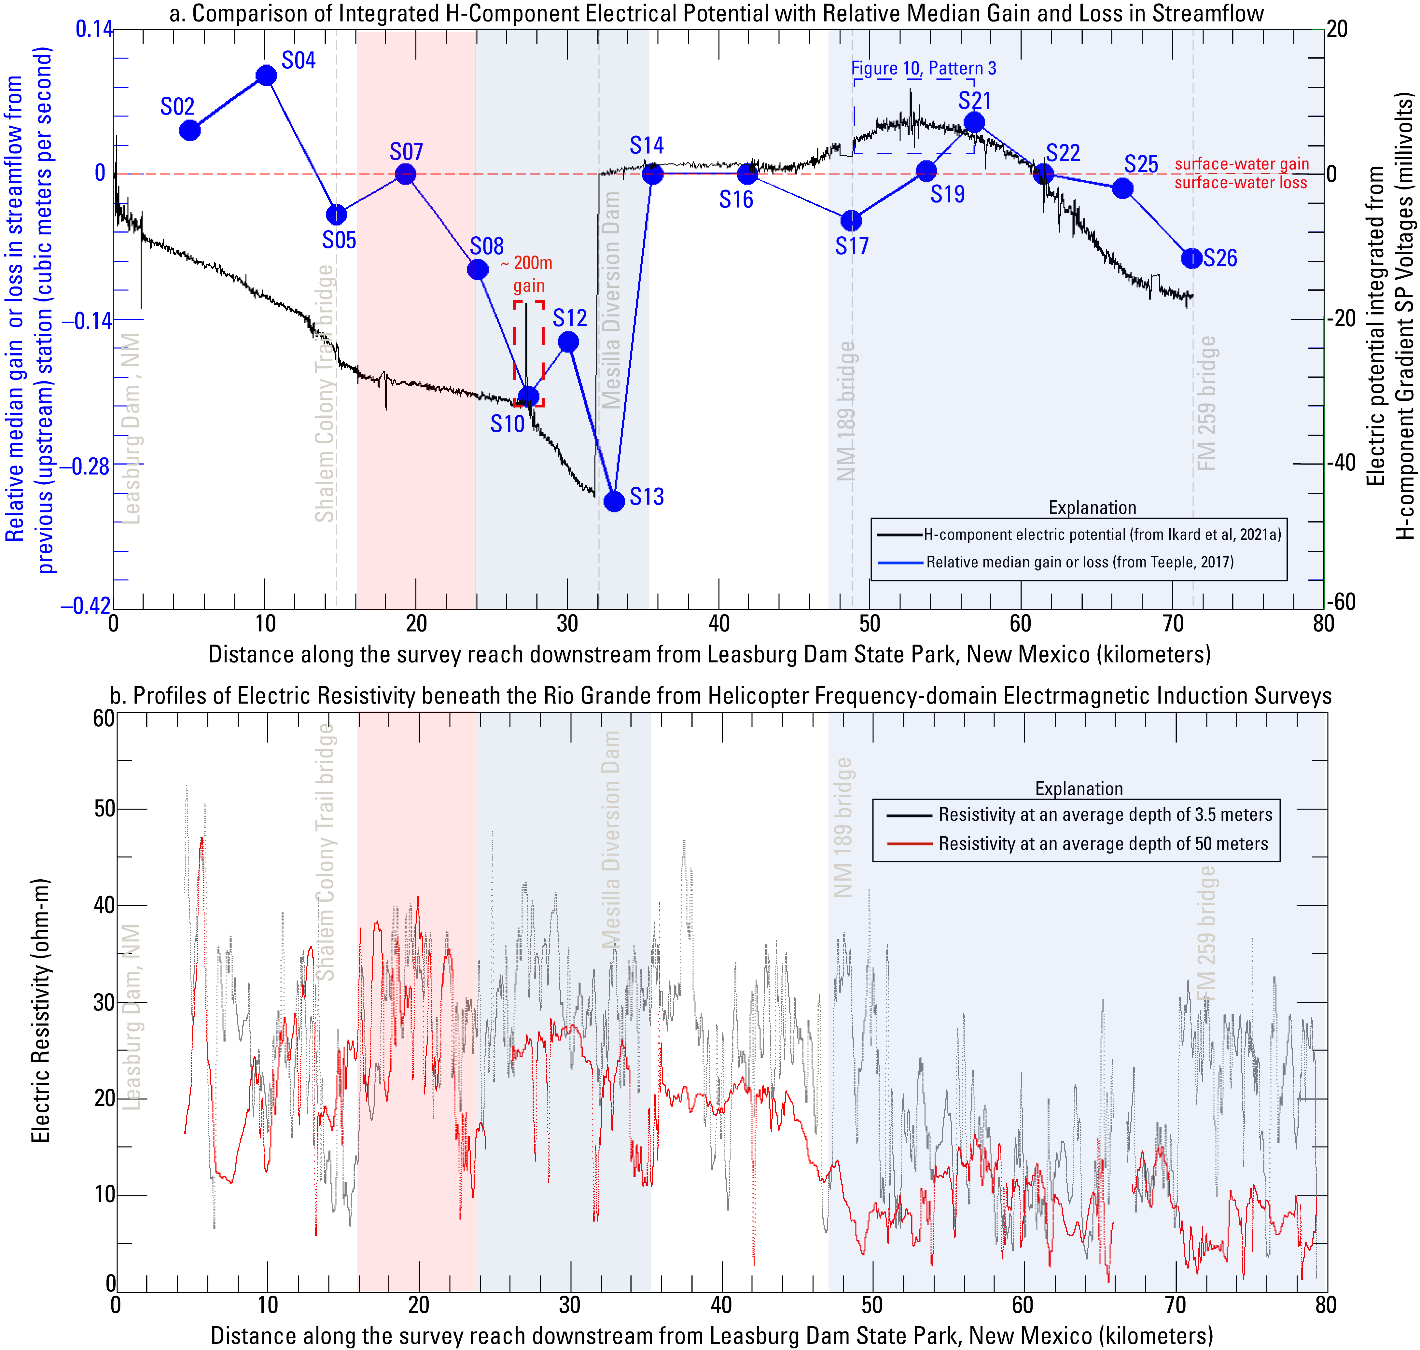
The streamflow gain/loss curve indicates that the Rio Grande is generally a losing river throughout much of the study area, but also that there are several reaches where a relative gain in streamflow may occur between adjacent stations. Net losses occur between stations S02 and S13 in spite of apparent net gains between S02 and S04, S05 and S07, and S10 and S12. Electric potential is entirely negative upstream from Mesilla Diversion Dam and decreases along the entire reach between Leasburg Dam and Mesilla Diversion Dam. The intermittent gain between S10 and S12 appears to be a result of a ~200-m long gaining reach demarcated by the discrete spike in the electric potential at S10. The increase in electric potential at Mesilla Diversion Dam between S12 and S13 is a result of the discontinuous nature of the electric potential profile across the dam, which represents a point of zero reference potential. A neutral condition (no apparent gain or loss) is indicated in the relative median streamflow gain/loss curve between S13 and S16 and corresponds to an approximately constant neutral-to-mild gaining condition shown by the electric-potential profile between Mesilla Diversion Dam and a point about 6 km downstream from S16. This neutral-to-mild gaining condition remains relatively constant for approximately 12 km downstream along most of survey segment 3. The net losing condition between stations S16 and S17 in the streamflow gain/loss curve is not clearly observed in the electric-potential profile and is a possible result of either a true gaining condition at the time of the survey or a strong vertical concentration gradient masking the losing condition in the streamflow gain/loss curve by a positive diffusion potential. The resistivity profile data in Fig. 3b support the latter based on the notable vertical decrease in resistivity between depths of 3.5 meters and 50 meters beneath the riverbed between stations S16 and S17. The net gain between S17 and S21 is clearly represented by the electric-potential profile by steadily increasing potential from negative to positive between 12 and 22 km downstream from Mesilla Diversion Dam from the end of segment 3 into approximately the first half of survey segment 4 before it peaks near station S19 and begins to decrease. The net loss between S21–S26 is clearly seen in the electric potential profile in the second half of survey segment 4, which decreases over an 18-km segment to the end of segment 4.
Conclusions
Waterborne gradient self-potential (WaSP) data were continuously logged along 72 kilometers of the left bank of the Rio Grande from Leasburg Dam, New Mexico, to Canutillo, Texas, during bank-full flow conditions between June 26 and July 2, 2020. At the time of the survey, the 32-km long reach between Leasburg Dam and Mesilla Diversion Dam showed a strong propensity for net surface-water losses along the entire reach, with only one location showing indicators of gain over a 200-m long reach. Downstream from Mesilla Diversion Dam, electric-potential data indicated a neutral-to-mild propensity for surface-water gain for approximately 12 km that increased between 12 km and 22 km downstream from Mesilla Diversion Dam where the gaining condition peaked and began transitioning to a losing condition along the remaining 18 km of the survey reach. The electric potential in the Rio Grande compared notably well with relative median streamflow gain/loss along the reach, and the combination of geophysical and hydraulic data interpreted herein shows the value and usefulness of WaSP logging in rivers for identifying gaining and losing reaches at the regional or basin scale. The methods and data processing described herein support the fundamental science objectives of the Transboundary Aquifer Assessment Act (Public Law 109-448) by expanding available geophysical tools and developing new datasets to assess groundwater and surface-water connectivity between transboundary aquifers and surface-water resources in the United States – Mexico border region. The approach used in this work has great potential for enabling better understandings of the extents to which transboundary aquifers may be used as sources of water supply, and a means of quickly assessing the vulnerability of transboundary aquifers to anthropogenic or environmental contamination through surface-water connectivity.
Acknowledgements
This work was done in collaboration with the International Boundary and Water Commission (IBWC) – United States Section under the Transboundary Aquifer Assessment Act (Public Law 109–448). We sincerely thank the Hydrologic Technicians at the U.S. Geological Survey New Mexico Water Science Center, Park Rangers at Leasburg Dam State Park, New Mexico, and IBWC staff for logistical assistance in the field. We thank Shawn Carr and William Seelig for assistance with data acquisition in the field. We thank the reviewers for assistance with improving this manuscript. Any use of trade, firm, or product names is for descriptive purposes only and does not imply endorsement by the U.S. Government. Writings prepared by U.S. Government employees as part of their official duties, including this paper, cannot be copyrighted and are in the public domain.
References
Alley, W.M., 2013, Five-year interim report of the United States-Mexico Transboundary Aquifer Assessment Program—2007–2012: U.S. Geological Survey Open-File Report 2013–1059, p. 1–31. https://doi.org/10.3133/ofr20131059.
Crilley, D.M., Matherne, A.M., Thomas, N., and Falk, S.E., 2013, Seepage investigations of the Rio Grande from below Leasburg Dam, Leasburg, New Mexico, to above American Dam, El Paso, Texas, 2006–13: U.S. Geological Survey Open-File report 2013-1233, p. 1–34, https://doi.org/10.3133/ofr20131233.
Ikard, S.J., Briggs, M.A., and Lane, J.W., 2021b, Investigation of scale-dependent groundwater/surface-water exchange in rivers by gradient self-potential logging: Numerical modeling and field experiments: Journal of Environmental and Engineering Geophysics, v. 26, no. 2, p. 83–98. https://doi.org/10.32389/JEEG20-066.
Ikard, S.J., Carr, S.M., Seelig, W.G., and Teeple, A.P., 2020, Waterborne gradient self-potential, temperature, and conductivity logging of the Rio Grande from Leasburg Dam State Park, New Mexico to Canutillo, Texas, June–July 2020: U.S. Geological Survey data release, https://doi.org/10.5066/P9GTF1QB.
Ikard, S.J., Teeple, A.P., Payne, J.D., Stanton, G. P., and Banta, J. R., 2018, New insights on scale-dependent surface and groundwater exchange from a floating self-potential dipole: Journal of Environmental and Engineering Geophysics, v. 23, no. 2, p. 261–287. https://doi.org/10.2113/JEEG23.2.261.
Teeple, A.P., 2017. Geophysics and geochemistry-based assessment of the geochemical characteristics and groundwater-flow system of the U.S. part of the Mesilla Basin/Conejos-Médanos aquifer system in Doña Ana county, New Mexico, and El Paso county, Texas, 2010–12: U.S. Geological Survey Scientific Investigations Report 2017-5028, p. 1–183, https://doi.org/10.3133/sir20175028.
Winter, T.C., Harvey, J.W., Franke, O.L., and Alley, W.M., 1999, Groundwater and surface water: A single
resource: U.S. Geological Survey Circular 1139, p. 1–88, https://doi.org/10.3133/cir1139.
Author Bios

Scott Ikard
Scott is a licensed Professional Engineer and Professional Geologist. He is currently a hydrologist in the Geophysics and Subsurface Analysis unit of the United States Geological Survey’s Oklahoma-Texas Water Science Center, in Austin, Texas. He holds a Ph.D. in Geophysical Engineering from the Colorado School of Mines, an M.E. in Geological Engineering from the Colorado School of Mines, and a B.S. in Geology from James Madison University. Scott serves as Project Chief on applied research studies in geophysics and hydrogeology.

Andrew P. Teeple
Hydrologist and Team Lead
U.S. Geological Survey
Central Texas Program Office
Geophysics and Subsurface Analysis Unit
1505 Ferguson Lane, Austin, TX 78754
Andrew P. Teeple earned his Bachelor of Science in Chemical Engineering at the University of Nebraska – Lincoln in 2005. As a student, he began working with the United States Geological Survey in the Nebraska Water Science Center in 2003. In 2006, Andy became a full-time Hydrologist for the Texas Water Science Center. As a hydrologist, he uses advanced borehole and geophysical techniques to aid in the interpretation of hydrogeologic characterization and framework, preferential groundwater flow paths, interaction potential between hydrogeologic units, groundwater/surface-water interaction, freshwater/saline-water transition zone delineation, conceptual model development, and other groundwater related concerns in the United States and internationally (Mexico, Canada, United Arab Emirates, Cambodia, and Thailand). In 2014, Andy began and continues to serve as the team lead of the Geophysics and Subsurface Analysis Unit (GSAU) in Austin, Texas. As a team lead, he coordinates the actions of the GSAU. During his 16 years with the USGS, he has been author or coauthor of multiple published scientific investigation reports.
