
Miriam Rios-Sanchez1, John S. Gierke2 and Teresa Muñoz-Martinez3
1Center for Sustainability Studies, Bemidji State University,1500 Birchmont Dr. NE, Bemidji, MN 56601
2Department of Geological and Mining Engineering and Sciences, Michigan Technological University, 1400 Townsend Dr., Houghton, MI 49931
3Departamento de Gestión de Recursos Hídricos, Gerencia del Ambiente. EPMAPS, Quito. Mariana de Jesús entre Alemania e Italia, Quito, Ecuador. 170515
Abstract
The Quito Aquifer System (QAS) of Ecuador is critical for providing potable water to Quito, the capital of Ecuador, and its metropolitan area. The QAS is a complex basin of sedimentary volcanic deposits. However, local and regional groundwater flows are at least significantly affected by faulting and fracturing in this tectonically active area. The Plateaus Region of the QAS is a very important source of water supplies. Springs and wells provide all the drinking water needed for the population centers settled in the Plateaus Region. As an initial step to evaluate the faulting and fracturing of the Plateaus, a lineament map of the Plateaus of the QAS was created using remote sensing and digital terrain analysis. Shallow geophysical methods were used as an independent approach to confirming the presence of fractures. Shallow geophysical methods are especially appropriate for confirming the presence, extent, and orientation of geological lineaments and detecting the presence of water in the fractures. Two-dimensional electrical resistivity profiling (2D-ER) was applied to define the extent and depth of shallow geological structural tectonic features mapped in the lineament analysis. Results indicate that lineaments are represented underground by fractures with an average depth of about 60 m.
Introduction
The Tumbaco Valley is formed by plateaus which are very important for water supplies. Springs and wells provide all the drinking water needed for the population centers settled in the Plateaus Region, with roughly 174,000 inhabitants. Local and regional groundwater flows are at least significantly affected by the occurrences of faulting and fracturing in this tectonically active area (Rios-Sanchez, 2012). Analyses of pumping tests and geochemistry suggest that hydrogeology is more complex than initially thought (Rios-Sanchez, 2012) and that groundwater flows are controlled by post-deposition structural features that potentially act, in some cases, as barriers, and in others, as preferential flow zones (Rios-Sanchez, 2012). The tectonic history has altered the landscape by forming depressions, valleys, and highly dissected areas shown in Figure 1. Lineament mapping using remote sensing and digital terrain analysis was first used to evaluate the faulting and fracturing on the Plateaus (Rios-Sanchez et al., 2012). The results indicated two main orientation trends for the lineaments. The NNW-SSE lineaments are primarily associated with regional features and are expressed as deep ravines. The SE-NW trends are primarily associated with fracture exposures observed on the ravine walls and geomorphic features corresponding to the deflections of the drainages.
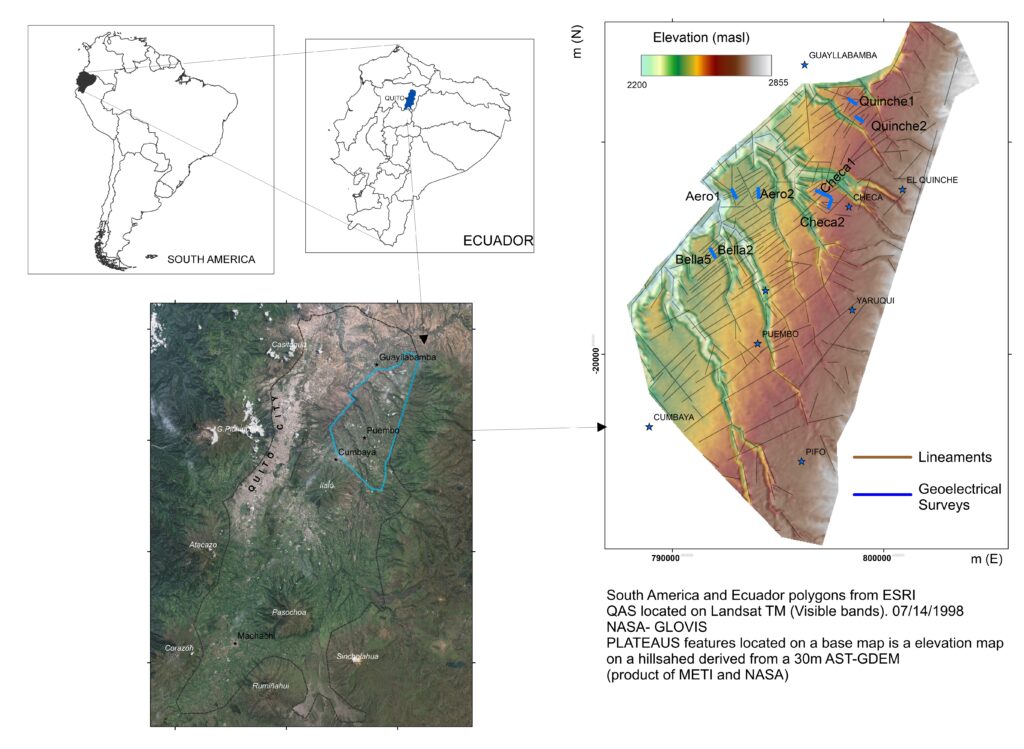
Figure 1. Location map. The Plateaus Region is located east of Quito, Ecuador. Plateau names are identified: CaP: Cumbaya, PP: Puembo, NAP: New Airport, ChP: Checa, CaP: Caleras, and QuP: Quinche.
Shallow geophysical methods are especially appropriate for delineating the extent and orientation of geological lineaments and detecting the presence of water in these lineaments. Electrical and electromagnetic geophysical methods have been widely used to map fractures by identifying the changes in resistivity that occur between fractured and intact rock due to the variation in properties such as permeability and saturation (Chandra et al., 2019; Skinner and Heinson, 2004; Torrese and Pilla, 2021). Two-dimensional electrical resistivity profiling (2D-ER) and very-low-frequency electromagnetic (VLF-EM) are among the most common methods used to map fractures (Adepelumi et al., 2006; Ganerød et al., 2006; Ramesh Babu et al., 2007; Sharma and Baranwal, 2005). Faults and fractures appear as contrasts in graphs of geophysical properties obtained. For direct current methods, contrasts reflect changes in electrical resistivity (Kirsch, 2006). Applications of VLF-EM for this region and karst terrain in the U.S. Territory of Puerto Rico are have done by Alonso-Contes (2011) and Rios-Sanchez (2012).
Contrasts in physical and geophysical properties of metamorphic and igneous rocks are often distinct and very obvious; however, volcanic and sedimentary deposit changes in resistivity between fractured and non-fractured areas are more subtle. Delineating the fracture boundaries in sedimentary deposits can be subjective (Demanet et al., 2001; Nguyen et al., 2005). Among the factors that contribute to the subjectivity of the interpretation is the quality of the acquired data, different options used during the inversion process, and the non-linearity of resistivity inversion (Nguyen et al., 2005). Moreover, subjectivity in the visual interpretation is influenced by the color scale used and criteria selected by the interpreter (Demanet et al., 2001; Nguyen et al., 2005).
Digital image processing algorithms have been used in processing geophysical data to reduce the bias of the interpretations that typically rely only on visual analysis (An et al., 2020; Carter and Lines, 2001; Caterina et al., 2013; Demanet et al., 2001; Nguyen et al., 2005; Piro et al., 2007). Omnidirectional and directional gradient filters applied to 2D-ER data can enhance boundaries (Pham et al., 2021; Pitas; 2001). Moreover, the locations of low-resistivity zones (potentially interpreted as planar discontinuities have been delineated by applying algorithms used in the extraction of drainage networks (Demanet et al., 2001; Nguyen et al., 2005).
The main goal of this study is to apply the 2D-ER profiling to define the lateral extent and depth of shallowly occurring geologic planar features mapped in the lineament analysis carried out by Rios-Sanchez et al. (2012). Digital image processing techniques were applied to the 2D-ER profiles to better describe variations in resistivity, considering the terrain’s heterogeneity.
Study Area
The Plateaus Region is part of the Valle de Tumbaco, located in the eastern part of the QAS. It belongs to a complex tectonic basin located in the central part of Ecuador adjacent to the Quito metropolitan area. The study area is characterized by a group of NW/SE-oriented low relief areas separated by wide valleys (Figure 1). Springwater is emerging from the sides of the Plateaus and supplies around 500 l/s of potable water for rural parts of the Quito Metropolitan Area. Tectonic structures such as the San Pedro Faults and the Guayllabamba lineaments serve, respectively, as the northern and western boundaries of the Plateaus, as depicted in Figure 1. The foothills of Cordillera Real make up the geologic boundary to the east, and the Ilaló Volcano and Cumbayá Valley form the southwest boundary. Sub-horizontal layers of lava flows, lahar deposits, pyroclastic flows, and fluvial and alluvial deposits are part of the geological formations that make up the Plateaus. The basement of the Plateaus comprises undifferentiated volcanic rocks of the Pallatanga Unit (Cretaceous) or the Pisque Formation of the Pleistocene age. The basal part of the Pisque Formation is composed of andesitic and basaltic lavas.
Method: Two-dimensional Electrical Resistivity Profiling
Geo-electrical methods are the most widely applied geophysical techniques for groundwater exploration (Adepelumi et al., 2006; Jamal and Singh, 2018; Sharma and Baranwal, 2005). The most common and basic electrical resistivity surveys for groundwater exploration are vertical electrical soundings (VES), which are only one-dimensional in nature. Two-dimensional electrical resistivity profiling (2D-ER) is described herein. The VES method is very useful for evaluating horizontally layered aquifers, while 2D-ER is also suited to detect lateral changes in electrical resistivity or electrical conductivity, such as water-bearing fractures (Hidalgo et al., 2010; Kirsch, 2006).
Data from the 2D-ER surveys were collected using the SuperSting R8/IP Resistivity meter (by Advanced Geosciences Inc., Austin, Texas, USA). For each profile, 56 electrodes were set up using a variable spacing from 6 to 15 m depending on the desired depth for a particular area. The control box followed a sequence of steps from a user-defined control file to operate the appropriate combinations of current and potential electrodes to complete the desired array (e.g., Schlumberger or Wenner in this work). Details regarding the azimuth, length, and array used are listed in Table 1. Locations of the 2D-ER profiles are indicated in Figure 1.
Table 1. Summary of the 2D-ER profiles carried out on the Plateaus Region. Coordinates are based on Universal Transverse Mercator (UTM) using the 1984 World Geodetic System (WGS84) ellipsoid for Zone 17M.
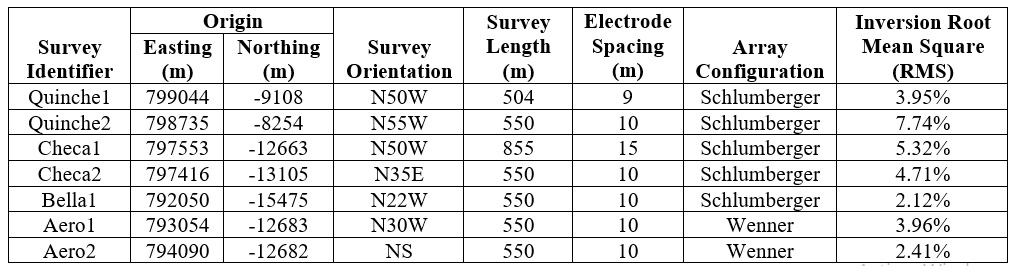
Electrical resistivity inversion was carried out using EarthImager 2D software® (by Advanced Geosciences Inc., Austin, TX), which employs a finite element method solver for the spatial approximations and a Cholesky decomposition method to solve the resulting system of equations. The root mean square (RMS) obtained for the inversions is included in Table 1. Gradient calculation, directional gradient filtering, and extraction of local minima (by using watershed modeling algorithms) were performed on each 2D-ER profile to improve the characterization of the horizontal and vertical variations in electrical resistivity. Gradient calculations and filtering were carried out using Surfer V.9.3 (by Golden Software Inc, Golden, Colorado, USA). Local minima maps were generated using the flow direction and flow accumulation algorithms in ESRI® ArcMapTM 10.0 (ESRI, Redlands, CA). Gradient sections were used to calculate horizontal boundaries. Lines of the maximum gradient were correlated to boundaries between layers. Vertical linear features (boundaries between east-gradient filtered zones), associated with a local resistivity minimum, were apparent–indicating the lowest resistivity point, and were correlated to saturated fractured zones (SFZ).

Results and Discussion
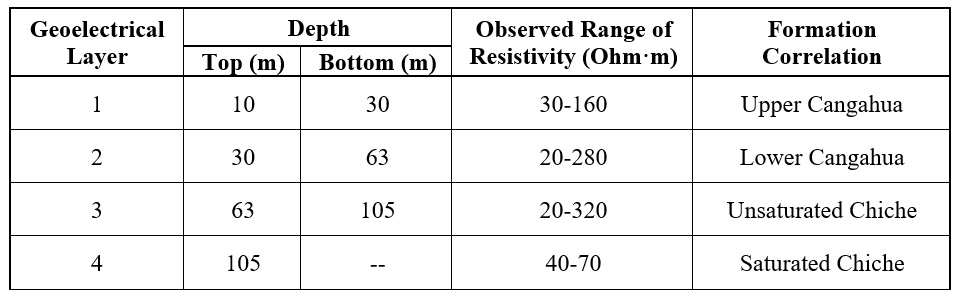
Given the complex distribution of the electrical resistivity in the first 10 m of depth, many features were interpreted from continuous vertical features below the 10-m depth. Three common horizontal geoelectrical layers were identified in the inverted resistivity sections (Figure 2) and gradients (Figure 3). These common layers are correlated with the two most-shallow geological units of the area. Depths, ranges of resistivity, and geological correlation are summarized in Table 2. Despite the similarities of the geological layers and their sub-horizontal nature, there are large variations in resistivity values across the plateaus, as observed in Figure 2 and Table 2. The surveys with the lowest resistivity layers were Quinche1 and Quinche2, with resistivity values between 30-160 Ohm·m. The highest resistivity values were observed in the surveys Aero1 and Aero2, with maximum values of 280 Ohm·m.
Table 2. Characteristics of the common geoelectrical layers identified in the surveys.
It is noteworthy to mention that these layers are spatially discontinuous, displaying lateral variation in resistivity. These lateral changes are probably due to the existence of vertical fracturing. Lateral variations in resistivity are also observed in all the surveyed areas (Figure 2). Surveys Checa1 and Checa2 had the largest variability in resistivity. Lateral variations were more easily observed on the raw data profiles than inverted ones.
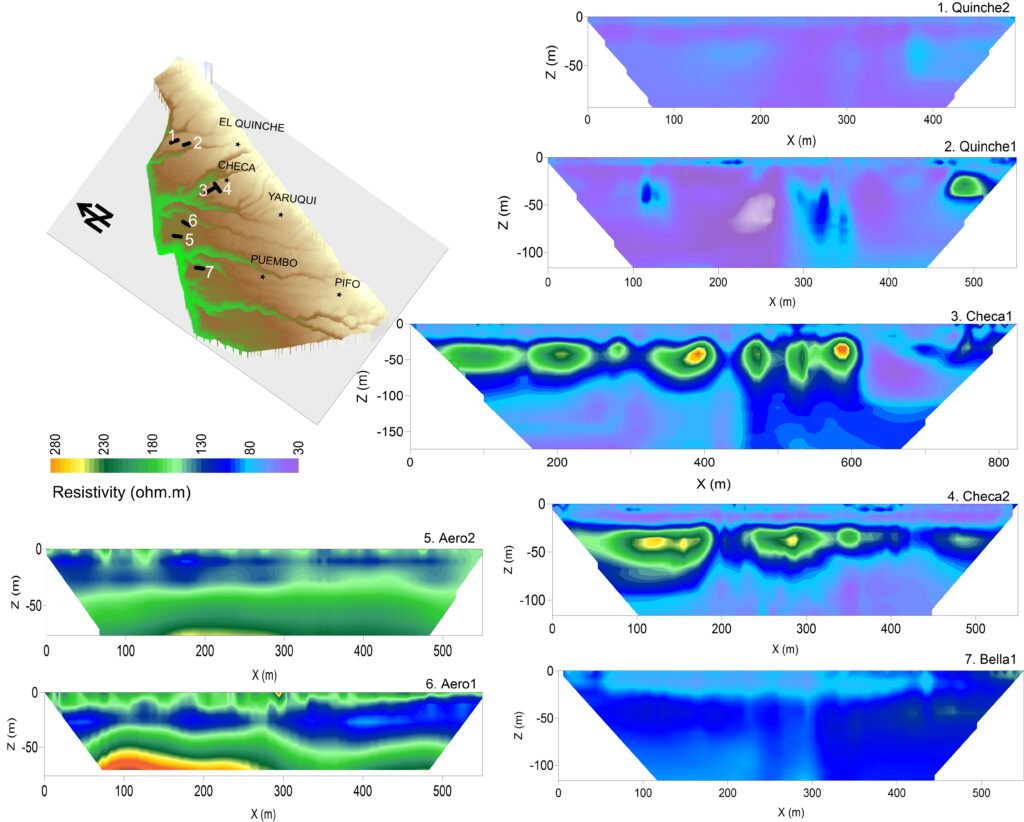
Figure 2. Map showing the location of the 2D-ER profiles carried out in the Plateaus Region. All 2D-ER profiles share the same resistivity scale; and Z represents the depth and X is length in meters along the survey line.
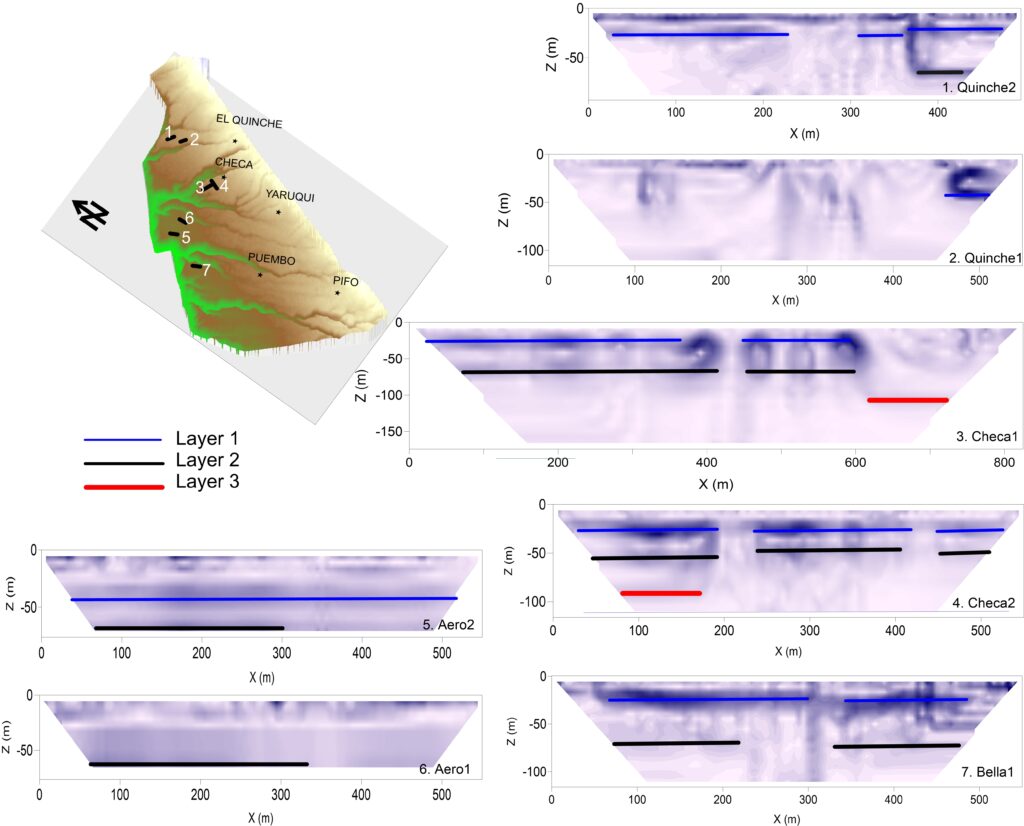
Figure 3. Images of the calculated electrical resistivity gradient for each 2D-ER profile, with corresponding common boundaries that define geoelectrical layers.
The results of the classification of the SFZ are presented in Figure 4. A total of 75 SFZs were mapped for the surveyed areas. The highest number of SFZs were observed in the Bella1 survey and the fewest for the Checa1 and Checa2 surveys. The average depth of the SFZ is 59 m (±40 m). The shallowest SFZs were found on the surveys Aero1 and Aero2. For these surveys, the SFZ is mostly shallower than ~30 m. This could indicate that fracturing affects the upper part of the New Airport Plateau. Figure 4 also indicates that features appearing in the crossing array apparently increase in depth toward the center of the profiles. This effect might be due to the data acquisition method.
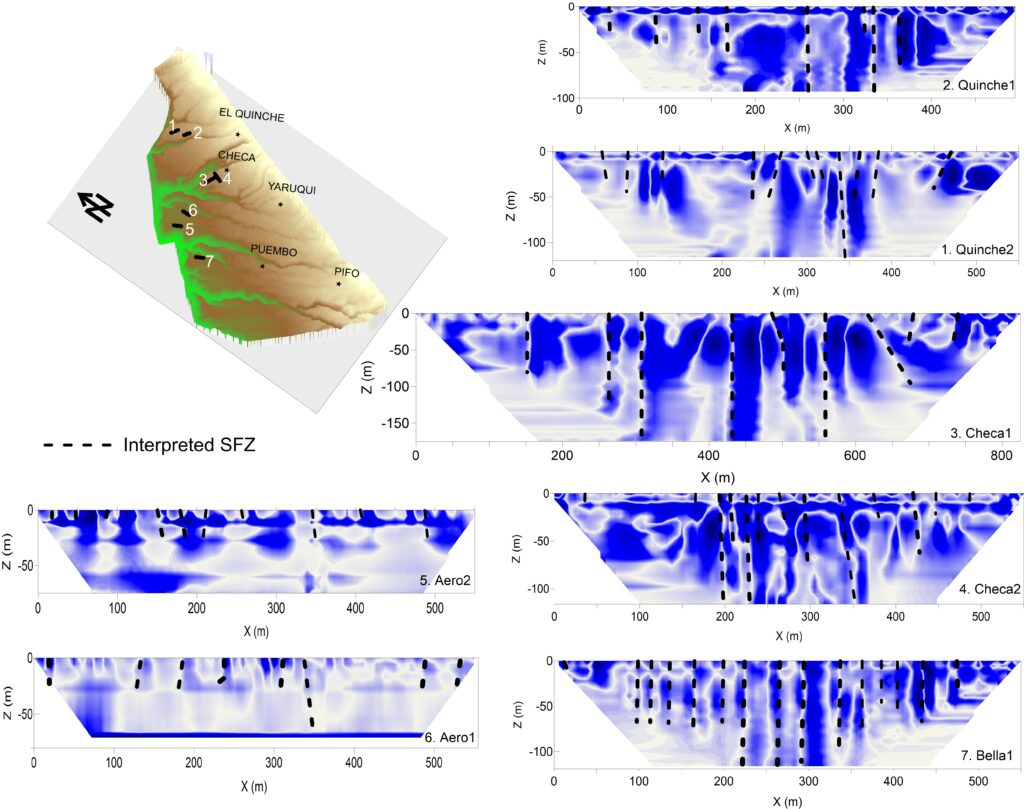
Figure 4. Images showing the location of interpreted sub-vertical SFZ on each 2D-ER profile based on the east-gradient filtered sections.
Relationships between lineaments and the interpreted fractured areas from the 2D-ER method were explored by overlaying the locations of those potential fractured areas on the lineament map created by Rios-Sanchez et al. (2012). The methodology used for the map was a combined remote sensing and digital terrain analysis approach where lineaments of regional origin were located. To improve the detail of the map, finer spatial-resolution images (ASTER VNIR, QuickBird) and DEMs were used. Lineaments were extracted by using high-spatial-resolution imagery combined with the aspect map derived from the DEM, providing the elements to map structures that at first appear locally as short features (on the slopes of the ravines) but actually have a larger extent and were spatially correlated to other fractures in a regional view. The detailed analysis revealed a new set of SW-NE lineaments not observed before. However, not all the short fractures observed were correlated to a lineament.
Geophysically interpreted fracture zones outnumber the number of lineaments mapped using remote sensing images by Rios-Sanchez et al. (2012). One of the reasons for the difference between the number of anomalies and lineaments is that the geophysical surveys detect more individual fractures whereas the lineament map depicts surface expressions of zones with multiple fractures. Geophysically detected features align with expressions of lineaments on the surfaces of the Plateaus and expressions of fracturing on the walls of the ravines. The agricultural activity on the Plateaus and the lack of geomorphologic evidence prevented the majority of the short fractures from being recognized and hence were not included on the lineament map (Rios-Sanchez et al. 2012). The distance between nearby short fractures agrees with the distance between geophysically detected features.
The lateral variation in electrical resistivity in the surveyed areas can also be related to the fact that the surveyed zones are mainly located in the unsaturated zone, which is located at depths of ~100 m. In the unsaturated zone, more variations in resistivity are expected, given the different degrees of water content that can occur and its influence, compared to the saturated zone. To verify the fracturing on the Plateaus, other geophysical methods should be applied. Rios-Sanchez (2012) describes results of VLF-EM surveys along the same 2D-ER surveys described herein, and those results mostly corroborate the interpretations of this 2D-ER work, but those results, in our opinion, are less conclusive.
Conclusions
The Plateaus Region is highly affected by fracturing. The impacts of this fracturing are expressed as lateral variations in the electrical properties of the rocks and unconsolidated sediments. This research demonstrates that the 2D-ER method is effective for subsurface characterization of fracturing in volcanic terrains. Lineaments mapped from remotely sensed imagery were correlated to saturated vertical fractures extracted from the 2D-ER profiles. Moreover, this detailed geophysics study likely indicates that more intense fracturing has occurred across the Plateaus. When analyzing the 2D-ER profiles laterally, it is observed that areas of high resistivity are often juxtaposed against zones of significantly lower resistivities. These variations may indicate the presence of zones of fracturing that act as preferential sub-vertical flow path areas or channels for rainfall and recharge from irrigation. These areas would have lower resistivities and were more frequently identified in the first layer and less frequently in the second and third layers.
Acknowledgments
This material is based upon work supported by the National Science Foundation under Grant No. 0530109. We are also grateful to the Water Utility Company of Quito, Ecuador (EPMAPS), especially to Oscar Larrea, for providing invaluable technical and logistical support for the development of this study. We are also grateful to Vinicio Naranjo, Guillermo Mendoza, Marco Morales (EPMAPS), and Dr. Carla Manciati for their participation in the fieldwork. Many undergraduate and graduate students from Michigan Technological University and the Escuela Politécnica Nacional in Ecuador participated in the fieldwork, too many to list, but their assistance is greatly appreciated.
References
Adepelumi, A., Yi, M.-J., Kim, J.-H., Ako, B., and Son, J. (2006). Integration of surface geophysical methods for fracture detection in crystalline bedrocks of southwestern Nigeria. Hydrogeology Journal, 14(7), 1284-1306.
Alonso-Contes, C. A. (2011). Lineament mapping for groundwater exploration using remotely sensed imagery in a karst terrain: Rio Tanama and Rio de Arecibo basins in the northern karst of Puerto Rico. Michigan Technological University.
An, N., Tang, C.-S., Cheng, Q., Wang, D.-Y., and Shi, B. (2020). Application of electrical resistivity method in the characterization of 2D desiccation cracking process of clayey soil. Engineering Geology, 265, 105416.
Carter, N., and Lines, L. (2001). Fault imaging using edge detection and coherency measures on Hibernia 3-D seismic data. The Leading Edge, 20(1), 64-69.
Caterina, D., Beaujean, J., Robert, T., and Nguyen, F. (2013). A comparison study of different image appraisal tools for electrical resistivity tomography. Near Surface Geophysics, 11(6), 639-658.
Chandra, S., Auken, E., Maurya, P. K., Ahmed, S., and Verma, S. K. (2019). Large scale mapping of fractures and groundwater pathways in crystalline hardrock by AEM. Scientific reports, 9(1), 1-11.
Demanet, D., Pirard, E., Renardy, F., and Jongmans, D. (2001). Application and processing of geophysical images for mapping faults. Computers & Geosciences, 27(9), 1031-1037.
Ganerød, G. V., Rønning, J. S., Dalsegg, E., Elvebakk, H., Holmøy, K., Nilsen, B., and Braathen, A. (2006). Comparison of geophysical methods for sub-surface mapping of faults and fracture zones in a section of the Viggja road tunnel, Norway. Bulletin of Engineering Geology and the Environment, 65(3), 231-243.
Hidalgo, A. L., Loke, M. H., Fanton, G. O., and Rubí, E. C. (2010). Técnicas prácticas para investigación de resistividad en dos y tres dimensiones (Tomografía Eléctrica 2D y 3D). In.
Jamal, N., and Singh, N. (2018). Identification of fracture zones for groundwater exploration using very low frequency electromagnetic (VLF-EM) and electrical resistivity (ER) methods in hard rock area of Sangod Block, Kota District, Rajasthan, India. Groundwater for Sustainable Development, 7, 195-203.
Kirsch, R. (2006). Groundwater geophysics: a tool for hydrogeology. Springer.
Nguyen, F., Garambois, S., Jongmans, D., Pirard, E., and Loke, M. (2005). Image processing of 2D resistivity data for imaging faults. Journal of Applied Geophysics, 57(4), 260-277.
Pham, L. T., Eldosouky, A. M., Melouah, O., Abdelrahman, K., Alzahrani, H., Oliveira, S. P., and Andráš, P. (2021). Mapping subsurface structural lineaments using the edge filters of gravity data. Journal of King Saud University-Science, 33(8), 101594.
Piro, S., Sambuelli, L., Godio, A., and Taormina, R. (2007). Beyond image analysis in processing archaeomagnetic geophysical data: case studies of chamber tombs with dromos. Near Surface Geophysics, 5(6), 405-414.
Pitas, I. (2000). Digital image processing algorithms and applications. John Wiley & Sons.
Ramesh Babu, V., Ram, S., and Sundararajan, N. (2007). Modeling and inversion of magnetic and VLF-EM data with an application to basement fractures: A case study from Raigarh, India. Geophysics, 72(5), B133-B140.
Rios-Sanchez, M. (2012). A remote sensing approach to characterize the hydrogeology of mountainous areas: Application to the Quito Aquifer System (QAS), Ecuador. Ph.D. Thesis.
Rios-Sanchez, M., Gierke, J. S., and Muñoz-Martínez, T. (2012). Hydrogeological characterization of the plateaus region of the Quito Aquifer system using remote sensing, digital geomorphology, and geophysics. World Environmental and Water Resources Congress 2012: Crossing Boundaries.
Sharma, S., and Baranwal, V. (2005). Delineation of groundwater-bearing fracture zones in a hard rock area integrating very low frequency electromagnetic and resistivity data. Journal of Applied geophysics, 57(2), 155-166.
Skinner, D., and Heinson, G. (2004). A comparison of electrical and electromagnetic methods for the detection of hydraulic pathways in a fractured rock aquifer, Clare Valley, South Australia. Hydrogeology Journal, 12(5), 576-590.
Torrese, P., and Pilla, G. (2021). 1D-4D electrical and electromagnetic methods revealing fault controlled aquifer geometry and saline water uprising. Journal of Hydrology, 600, 126568.
Author Bios

Miriam Rios-Sanchez, Ph.D., is an associate professor of geology at Bemidji State University. She holds a B.Sc. in Geology, an M.E. in Hydrology and Water Resources, and a Ph.D. in Geological Engineering. She has more than 15 years of teaching experience in classes related to several areas of Geology, Groundwater Resources, Hydrology, and Interpretation and Use of Satellite Images for Environmental and Geological Studies. She worked as a hydrogeologist for more than 10 years at the Colombian Geological Survey. She has experience in research on remote sensing and digital elevation model techniques for geological sciences, studies related to regional groundwater exploration, aquifer evaluation and management, and shallow geophysics for aquifer characterization and contamination. Although her academic life has been centered in the US in the last decade, she has broad experience working in Colombia. She has also worked in Ecuador, Dominican Republic, and Puerto Rico. [email protected]

John S. Gierke, Ph.D., P.E., is a professor of geological engineering at Michigan Technological University, a career in research and education spanning more than three decades. He holds a B.Sc. and M.S. degrees in Civil Engineering and a Ph.D. in Environmental Engineering. He and his students have worked on groundwater exploration and characterization projects using field geophysics and remote-sensing methods in the Keweenaw Peninsula of Michigan and volcanic terrains in Nicaragua, Ecuador, and El Salvador. [email protected]
Teresa Muñoz Martínez, M.Sc., is the Water Resources Management Department chief at Water and Sanitation Enterprise of Quito, Ecuador. She holds a B.Sc. in Geology and an M.Sc. in Geological Engineering. She has more than 18 years of experience in groundwater exploration, groundwater characterization, and aquifer management projects. Currently, she is part of the Research Station “Agua y Paramo,” where she has participated in applied research for integrated water management in Quito, Ecuador.
