
By Jamaludin Othman
subMAP Geophysical Services, 17 Jalan Setia Wawasan U13/31, Setia Alam, 40170 Shah Alam, Selangor, Malaysia
Abstract
In recent developments, electrical resistivity tomography (ERT) has been utilized to estimate the subsurface volume of materials to be extracted and removed. Two case studies are presented to show the workflow of how this can be carried out effectively. The first case study was to estimate the volume of dump materials at two landfills to be extracted and removed to make way for the construction of a mass-rapid transit (MRT) depot. The second case study was for the construction of a by-pass at an existing highway where it was required to estimate the volume of soil and rock. In both cases, there were issues and complexities to determine and define the interfaces (boundaries) separating the materials to be extracted and removed from those which should remain intact. This procedure is required to extract the thicknesses of these materials which will then enable the volume estimation to be made. Integrating and correlating additional data (borehole and test pits) together with the ERT interpretation allow the interfaces to be determined with reasonable accuracy.
Introduction
The use of electrical resistivity tomography (ERT) or 2-dimensional electrical resistivity imaging (2D-ERI) in mineral/groundwater exploration and geotechnical/site investigations is well known. In mineral exploration, ERT is mainly used to map conductive mineralized zone. Groundwater aquifers, whether in alluvium or hard rock environment, exhibits notably different range of resistivity values from the non-acquifer formation. ERT is well suited to map these differences. Mapping bedrock interface and subsurface lithological layers have been the most commonly used applications of ERT in geotechnical and site investigations.
In recent developments, ERT has been pushed to another level where its extended application in geotechnical/site investigations to estimate the subsurface volume of materials to be extracted and removed have proven viable, reliable and effective. This paper will discuss two case studies where ERT was specifically used for this purpose.
Methodology
The following sequence describes the workflow to estimate the volume of subsurface materials to be extracted and removed. First, coordinates and elevations (reduced level) at each electrode position are determined. Prior to the commencement of the ERT survey, a dedicated survey team was employed in preparing the survey lines. The critical factors that need to be determined are the coordinates (x, y) and reduced level (RL) of each electrode. These have to be determined accurately as they will directly affect the accuracy of the volume estimation.
Next, ERT data were acquired and inverted. The survey was carried out with the ABEM SAS-4000 Terrameter system. A 5m electrode interval with a 41-electrode configuration was used for the surveys, deploying the Wenner-Schlumberger protocol. ERT inversion to obtain the subsurface lithological profile for all the survey lines was carried out using the RES2DINV software. All data were evaluated and went through strict data control procedures to ensure only good quality data were passed through for inversion. This included removing data with negative apparent resistivities and very low voltages, typically < 1 mV. Bad data and outliers were also removed using the quality control module available in RES2DINV. However, care was taken not to remove too much of the data. A guideline was set not to remove > 20% of the total acquired data.
Estimating the thickness and volume of subsurface materials to be extracted and removed
As a first step to estimate the volume of subsurface materials to be extracted and removed, the thickness of the materials must be known. This was done manually by extracting them from the inverted ERT images for each survey line. This procedure was rather time consuming as it has to be carefully carried out to avoid errors during extracting the thicknesses.
It is critical to interpret and define the interface between the subsurface materials to be removed from those which should remain in-situ. This is a tricky situation as the ERT images show 2-dimensional features which often obscures the interface. If the interface is not determined accurately, it will lead to difficulty and inaccuracy in extracting the thicknesses. Consequently, the volume estimation would also be affected as the accuracy would be degraded.
At each electrode position, the thickness of the materials to be extracted and removed was determined with reference to the final reduced level (FRL) of the ground. This was then tabulated into an Excel table together with the coordinates (x, y) and reduced level of the electrode.
The volume calculation was carried out by first generating a contour map of the thicknesses of the materials to be extracted and removed at each electrode position. This is a straight forward procedure which can easily be carried out with any contouring package such as SURFER. Most contouring packages would have a built-in menu for volume calculation. The volume calculation can be done automatically by just invoking the relevant menu.
Case Study 1: Estimating the volume of dump materials
The Klang Valley Mass Rapid Transit Line 2 (KVMRT2) Project was one of the biggest infrastructure projects carried out in Malaysia. A component of the project involved the construction of a depot at two existing landfill sites, of which one was still active. Before construction can proceed, the dump (waste materials) at both landfills needed to be extracted and removed. The interest was to estimate the cost of extracting and removing the dump which would require the volume to be known.
Figure 1 shows the layout of the ERT survey lines which were determined by the Client. A total of thirteen (13) ERT lines of varying length, 90 to 200m were surveyed. Six (6) lines were located at the still active landfill whereas the others were at the dormant landfill.
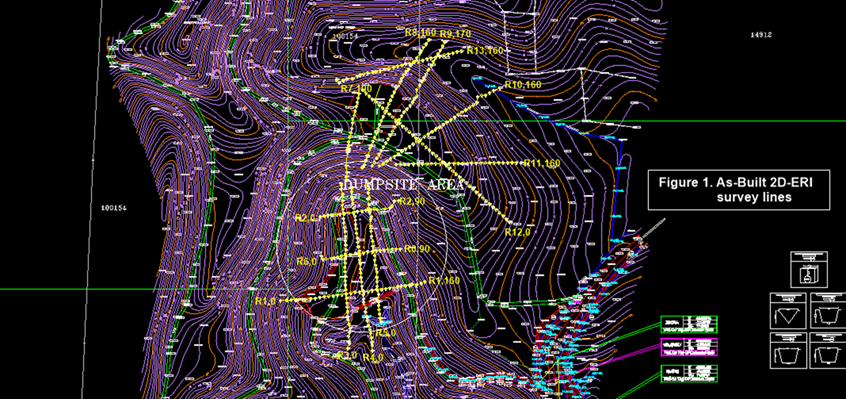
Figure 1. Layout of ERT survey lines
Only selected ERT images (Figures 2 and 3) are presented from both landfill sites as samples in this case study. This would be sufficient to show part of the workflow in the volume calculation. Figure 2 shows the interpreted ERT image of Lines R3, R4 and R5 located at the active landfill site. Lines R4 and R5 show the presence of dump materials as the top layer up to a depth of about 5 m. Below this layer is the bedrock with resistivity > 750 Ωm. However, the features observed on Line R3 are significantly different from R4 and R5. The dump materials are observed only as patches at either end of the line separated by a ~25 m thick sequence of predominantly sand (100 to 200 Ωm). At a distance between 60 to 95 m, a 10 m-thick layer of filled materials with resistivity values equivalent to that of the bedrock (> 750 Ωm) is observed.
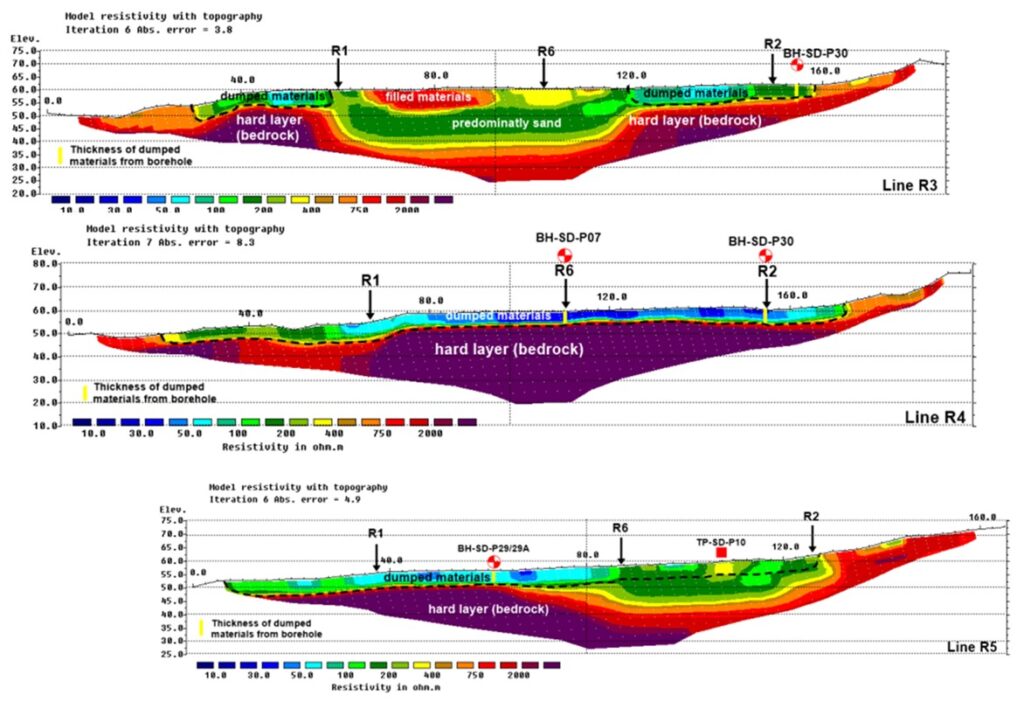
Figure 2. Interpreted ERT images for Lines R3, R4 & R5 @ the active landfill site
Figure 3 shows the interpreted ERT images of Lines R7, R8 and R9. Except for R7, similar features are observed for R8 and R9. Line R7 only indicates the presence of dump materials towards the end of the line, at about 80 m distance. Elsewhere, R7 is dominated by high resistivity values of > 750 Ωm, constituting the bedrock. Lines R8 and R9 show a very thick top layer of dump materials (< 50 Ωm) reaching almost 28 m in the middle of the profile. A 100 to 200 Ωm layer (attributed to predominantly sand) is also prominent on line R9, underlying the dump materials. This layer is not observed on line R8. Lines R8 and R9 shows that subsurface layers are not flat but inclined, following the general topography of these lines.
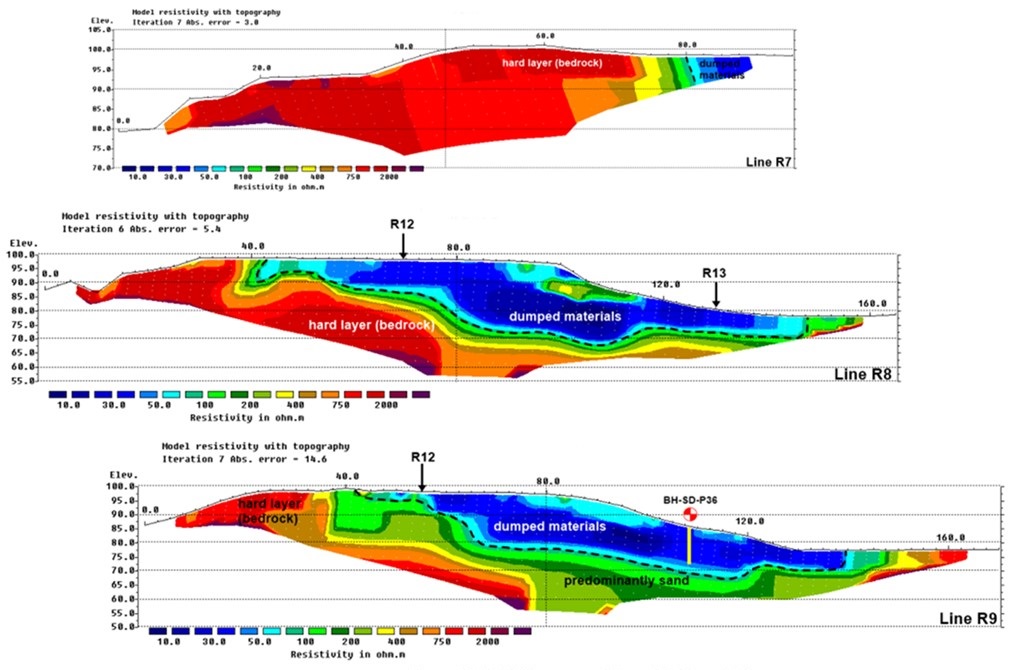
Figure 3. Interpreted ERT images of Lines R7, R8 and R9 at the dormant landfill site.
Distinctively low resistivity values of < 50 Ωm are attributed to dump materials. These low resistivity values are inferred to be caused by leachates/contaminants due to continuous and prolonged dumping of materials in the landfills. Figures 4 and 5 are contour maps showing the thicknesses of dump materials at both the active and dormant landfill sites respectively. The contour maps were generated by picking-up the thicknesses of the dumped materials from all the ERT images and tabulating them in an Excel worksheet. These worksheets were used as the input data file to generate the contour map using SURFER software. The contour map suggests that the thickness of the waste materials is between 4 and 10 m at the active landfill site. However, the dump materials layer is much thicker at the dormant landfill site, reaching about 28 m. Subsequently these maps were used to estimate the volume of dump materials to be extracted and removed at both the active and dormant landfill sites.
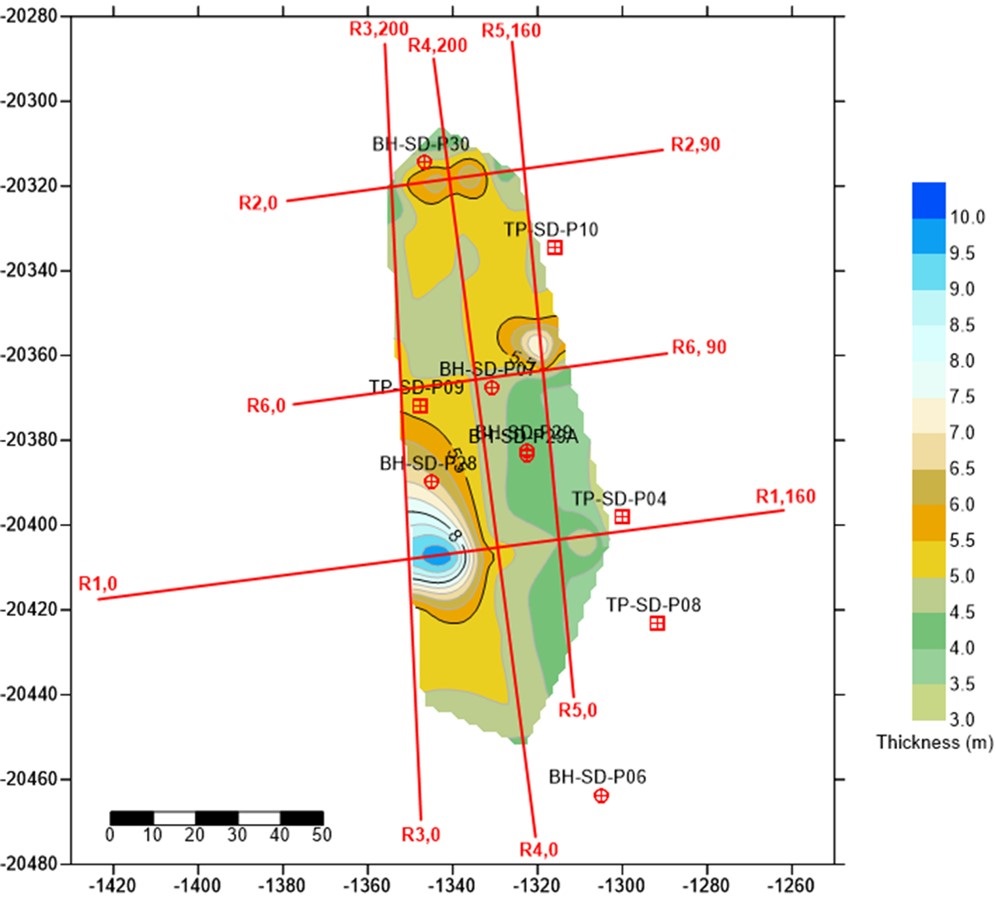
Figure 4. Thickness of dump materials at the active landfill site.
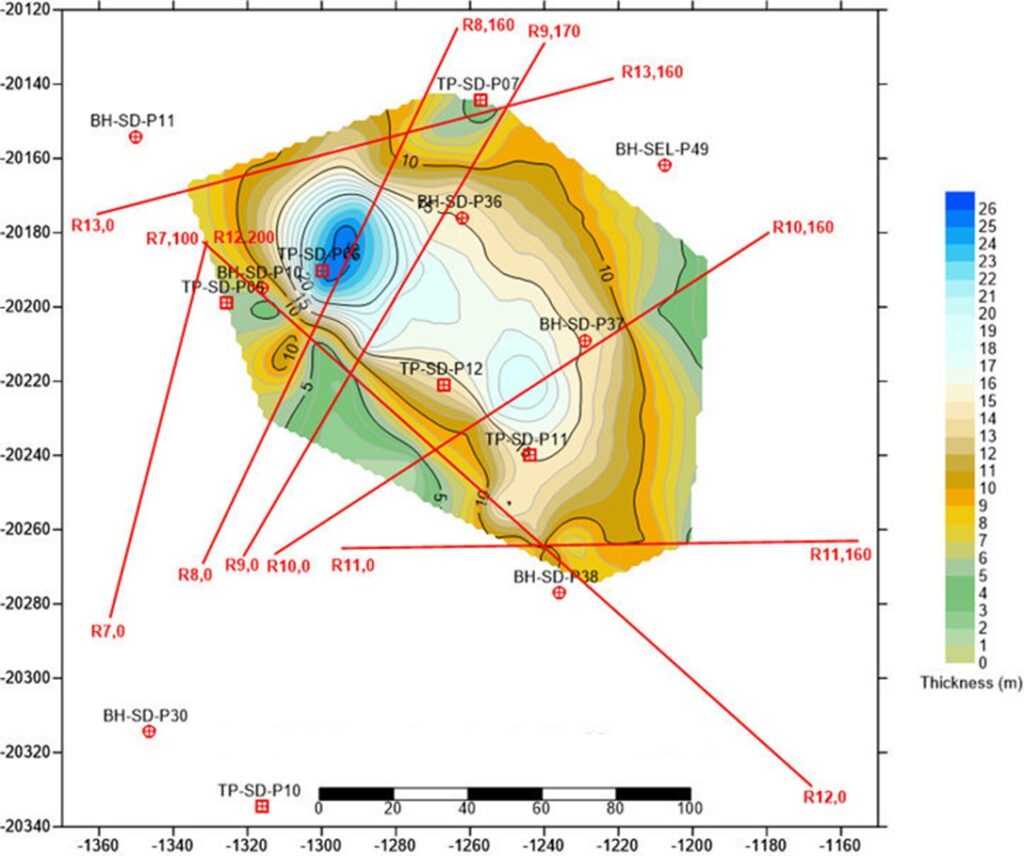
Figure 5. Thickness of dump materials at the dormant landfill site.
Case Study No 2 : Estimating the volume of overburden (soil) and rock
An ERT survey was carried out at a proposed by-pass along an existing highway in Malaysia’s popular island state. The primary objective of the survey was to estimate as precisely as possible the volume of soil and rock to be removed to make way for the construction of the by-pass. This would in turn assist the client in determining the likely cost to be incurred in the removal works with greater certainty. The proposed alignment of the by-pass is shown in Figure 6.
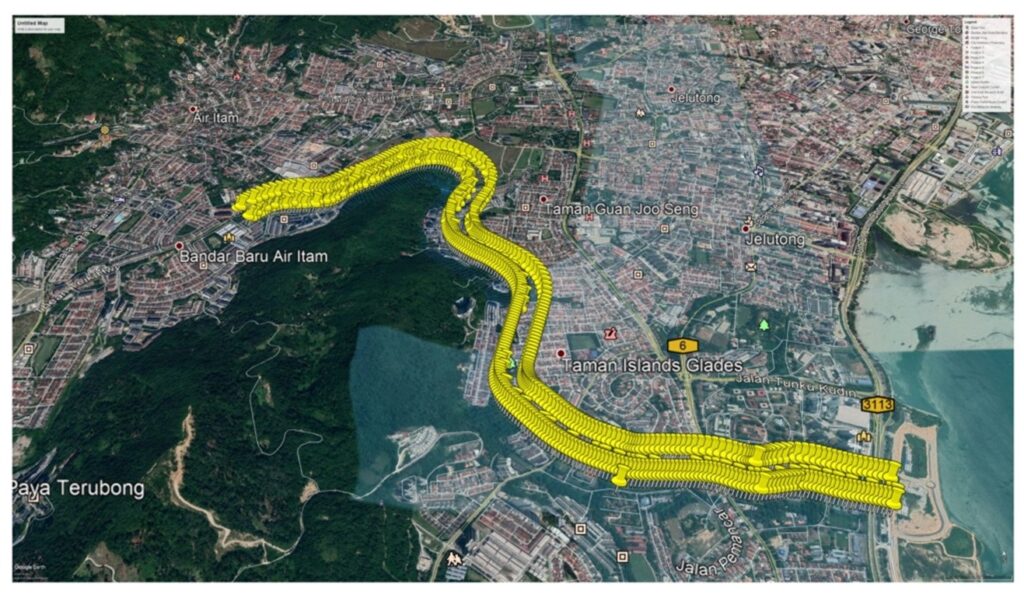
Figure 6. Proposed design of the by-pass.
A total of fourteen ERT lines were surveyed, as shown in Figure 7 superimposed on the site elevation map. The layout of all the survey lines were determined by the client. The original proposal was to have a 200m length for all the ERT lines. However, due to site constraints, this was not possible. The survey lines varied between 100 to 200m in length.
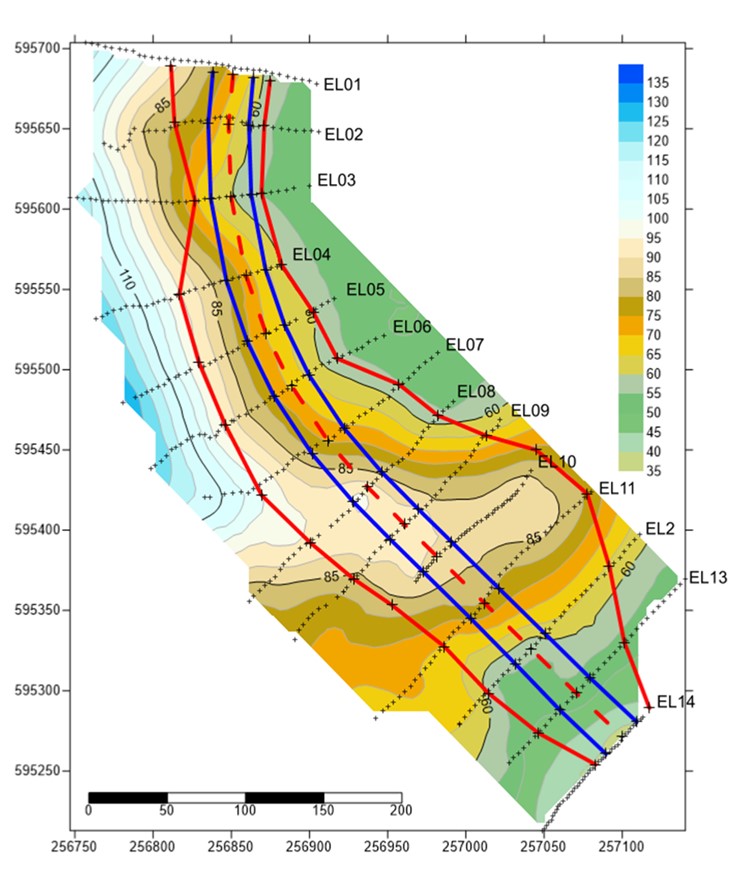
Figure 7. Layout of the ERT survey lines.
Only a few ERT images are shown to describe the interpretation. These are sufficient to provide a good representation of the subsurface resistivity structure for the whole site as the images are selected from the northern (Figure 8), central (Figure 9) and southern (Figure 10) parts of the site. Generally, the subsurface resistivity structures comprise the following range of values: (i) < 300 Ωm; (ii) 300 to 1000 Ωm; (iii) > 1000 Ωm. The < 300 Ωm resistivity range is consistently observed as the uppermost layer within the subsurface. However, it does not seem to be continuous throughout all the survey lines. It is consistently observed within the first 20m, beyond which it is no longer observable. The minimum thickness observed is about 10m. This range of resistivity is attributed to a mixture of sand, gravel and clay/silt. The amount of clay/silt content greatly influenced the resistivity value. An increase in the amount of clay/silt content will further decrease the resistivity value. This is evident where some of the observed resistivity values on the ERT images (such as EL01, EL02 in Figure 8) are < 50 Ωm, indicating a substantial increase in clay/silt content.
The 300 to 1000 Ωm resistivity range is rather complex as it is observed in two different environments within the subsurface. In some survey lines, this range of resistivity is observed as the uppermost layer with considerable thickness and extent as can be seen on Line EL05 (Figure 9). On other survey lines, such as EL06 (Figure 6) it is observed to occur within a very resistive environment with resistivity range of > 1000 Ωm. It would require different interpretations to accommodate both environments where this resistivity range is observed. If it occurs as the uppermost layer, it would likely be dry sandy/gravelly soil. However, if it occurs within a very resistive environment, it is interpreted as fractures (joints and faults) within the bedrock. The > 1000 Ωm resistivity range is observed throughout all the survey lines. These represent a very hard layer, typically bedrock which is granite at the site. On Line EL06 (Figure 9), a significant geological structure (likely an inclined fault) is interpreted. This structure has resulted in an approximately 30m wide fracture zone to be formed.
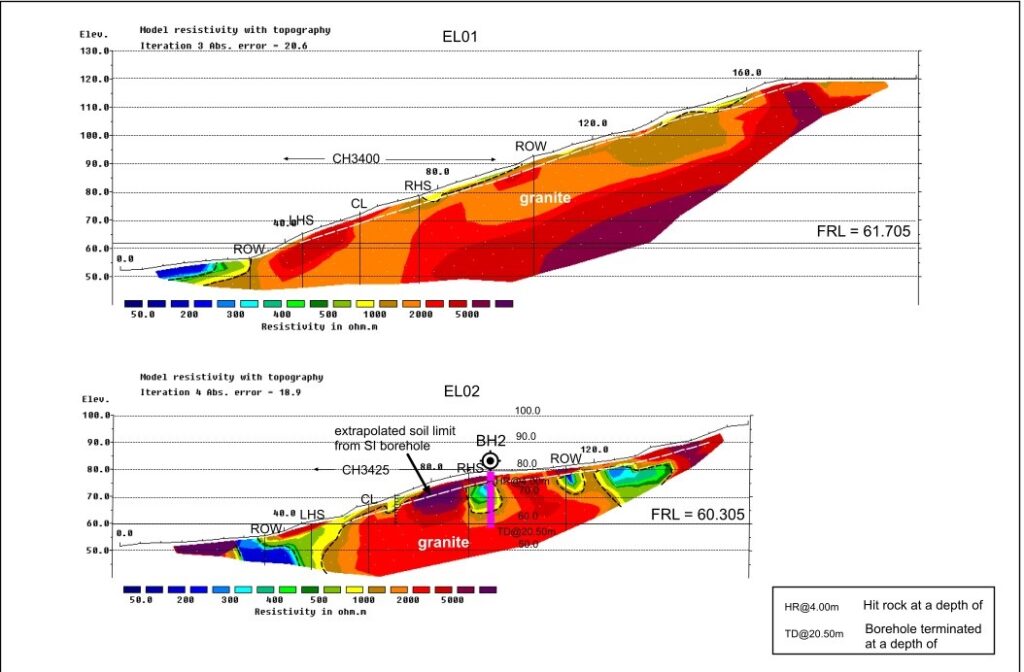
Figure 8. Interpreted ERT images of Lines EL01 and EL02.
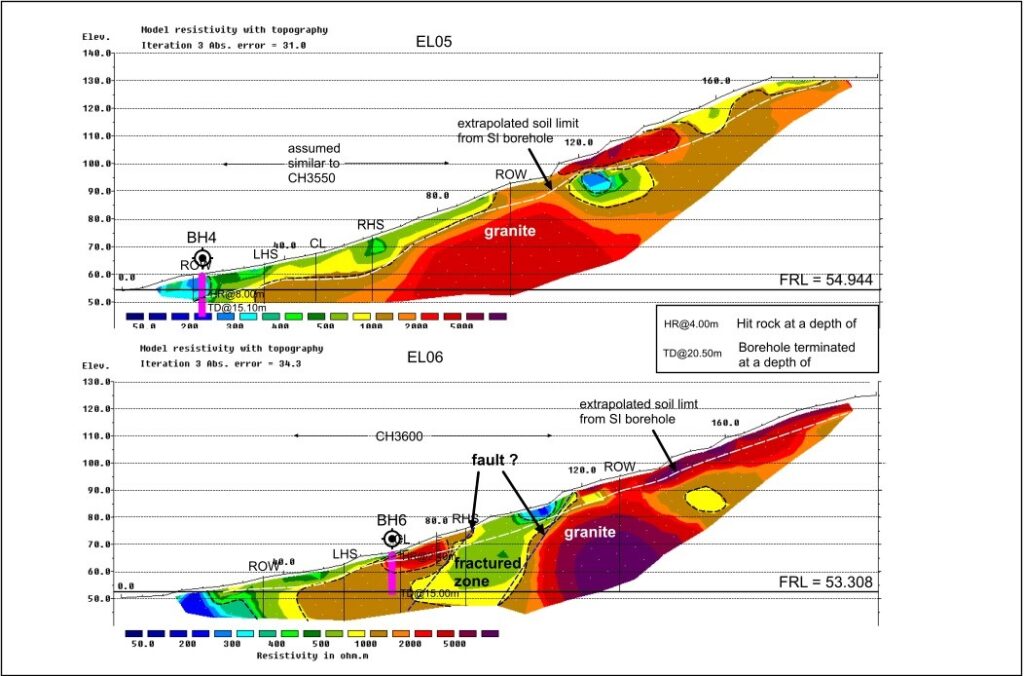
Figure 9. Interpreted ERT images of Lines 05 and 06.
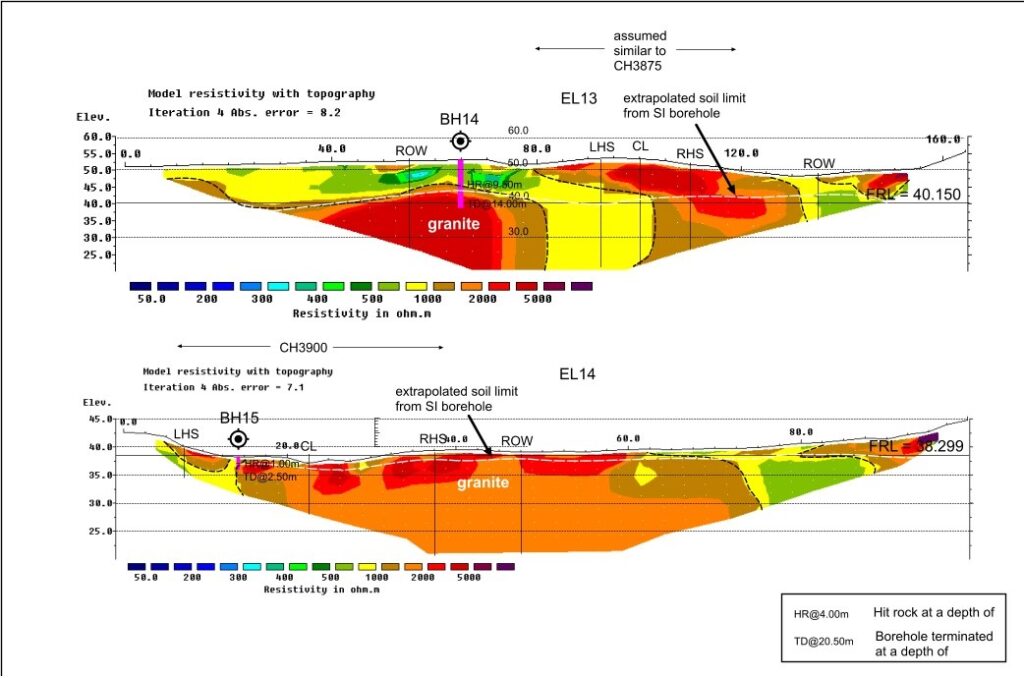
Figure 10. Interpreted ERT images of Lines EL13 and EL14.
Volume estimation
The client provided the proposed cut-sections in CAD drawings from chainages CH3225 to CH3900 where the volume of soil and rock is to be estimated. However, ERT survey only covered CH3400 to CH3900 (Figures 11 and 12). Thus, the soil and rock volume estimations can only be done for these chainages. These proposed cut sections were then located on the ERT images of all the survey lines, such as shown in Figures 8 to 10. Several of these sections (examples CH3450 and CH3500) do not fall on any of the ERT survey lines. In such situation, the closest chainage to the survey line was used to locate the section on to the relevant ERT image.
The calculation of soil and rock volume commenced with the extraction of the thickness of both soil and rock at each electrode position of the proposed cut sections with respect to their reduced levels. Much of the soil thicknesses had to be extracted from the extrapolated soil limit as indicated on all the 2D-ERI images. This had to be done as it was not possible to clearly define the soil/rock interface due to their overlapping range of resistivity values. The finished road levels (FRL) given on the proposed cut sections for each chainage was used as a reference level to extract the thicknesses of the rock. The soil thickness was then subtracted to obtain the actual thickness of the rock at each electrode position. Both the soil and rock thicknesses were then tabulated in Excel together with the coordinates at each electrode position. These data were then gridded and contoured using SURFER software. Figures 11 and 12 show the thickness of the soil and rock for chainages CH3400 to CH3900 respectively.
The computation of the soil and rock volume was performed on the gridded data by SURFER. The results are shown following table for chainages CH3400 to CH3900:
| Description | Computed Volume (m3) |
| Soil | 334,000 |
| Rock | 349,000 |
| Total | 683,000 |
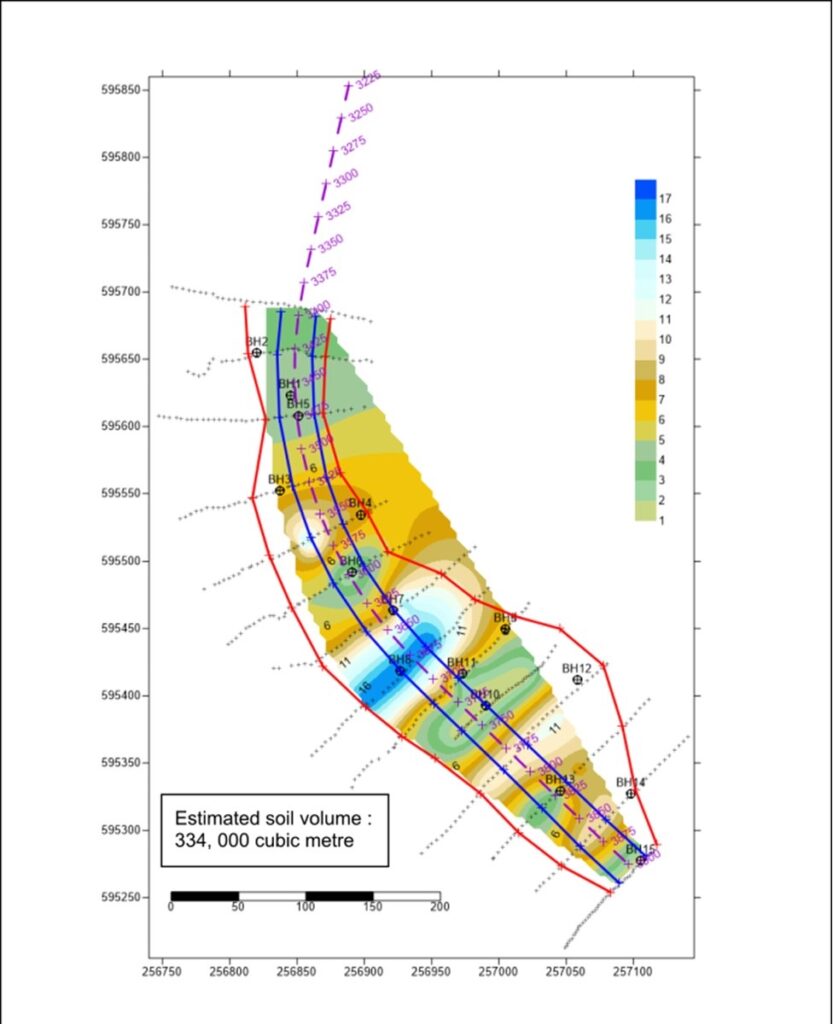
Figure 11. Estimated soil volume.
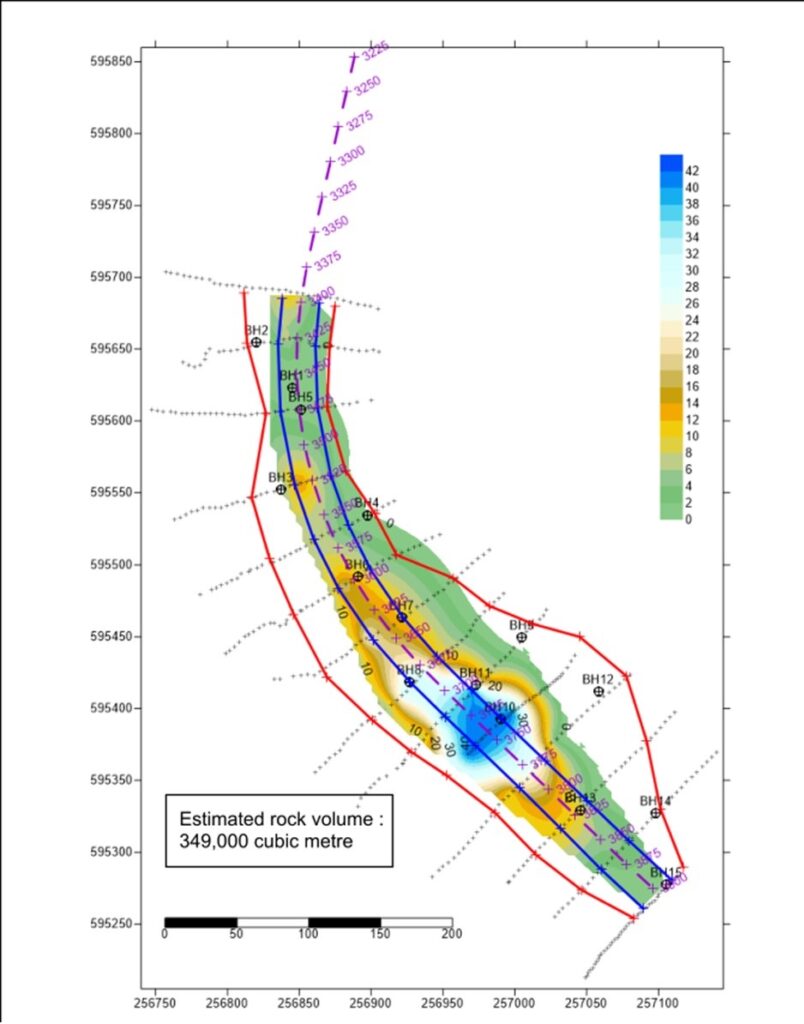
Figure 12. Estimated rock volume.
Discussion
Volume estimation of subsurface materials has provided a new dimension in the application of ERT in geotechnical/site investigation. The two case studies discussed have similar objectives with different approaches and issues to be resolved. A common critical issue which severely affects the accuracy of volume estimation is interpreting and defining interfaces (boundaries) between materials to be extracted and removed and those which should remain intact.
In the first case study, the boundary of the dump materials has gone through several revisions and was finally determined by carefully considering several factors. In most instances, it was sufficient to determine the boundaries by making geophysical judgements. This is done by looking at rapid and sharp changes in resistivity values on the ERT images, the typical ranges of resistivity values, correlation between lines and at intersection points of lines. These were the main criteria employed in estimating the boundary of dump materials in the preliminary interpretations. However, there were ambiguities (especially with regards to the lateral extent of the dump materials) which needed to be resolved. There are a number of existing boreholes and test pits at both landfills. These boreholes and test pit results were made available for correlation with the results ERT survey. These data were fully utilized to revise the boundary (laterally and vertically) of the waste dumps and to resolve ambiguities. Surface observations also assisted in the process of determining the boundaries. The final version of the contour map was only generated after all ambiguities with regards to the boundaries were resolved. The maps then should provide a reasonable estimate of the areal extent and thickness of the waste materials at both landfills.
The second case study involved estimating the volume of two different types of materials (soil and rock) to be extracted and removed. Unlike the first case study, where the dump materials formed the uppermost layer and generally have a very sharp interface, the soil -rock interface in this study was difficult to interpret and define. The resistivity range of the soil overlaps with that of the granitic bedrock, in particular within the range of 1,000 to 10,000 Ωm. It would not be possible to effectively discriminate between the soil layer and granitic bedrock due to this overlapping range of resistivity values. Two-dimensional features observed on many of the ERT images contribute to the complexity of interpreting and defining the soil and bedrock interface. Fifteen borehole logs were made available by the client to assist and guide the ERT interpretation. Drilling was carried out by a contractor appointed by the client and commenced almost simultaneously as the ERT survey. However, drilling of the boreholes took a longer time to be completed. The boreholes were terminated at various depths, the shallowest was at 2.5 m and the deepest at a depth of 44.6 m. The main contribution of the boreholes to the ERT was in determining the thickness of the soil layer. For the purpose of this investigation, soil is defined as any material overlying the bedrock. Most borehole logs described the soil layer as hard, very stiff, stiff, dense sandy/gravelly silt. This description suggests that the resistivity range would be relatively high, just as shown on many of the ERT images. The soil layer was then extrapolated from the boreholes with the assumption that the thickness is almost uniform throughout the survey line. However, on some ERT lines the soil layer is distinctly distinguishable by a much lower range (300 to 1,000 Ωm) of resistivity values. This is likely made of dry sandy/gravelly soil. If these materials are present on the survey lines, the extrapolated soil limit will follow this interface.
In both case studies, it was desirable to determine the coordinates (x, y) precisely and the reduced level at each electrode position should not be treated lightly as it would affect the accuracy of volume estimation. Constant communication should be maintained between the ERT and survey teams to avoid errors during field data acquisition such as missing/misplaced, incorrect positioning and reduced levels of electrodes. This in turn would also contribute directly to errors in the volume estimation.
Conclusions
Application of ERT has been lifted to another level in geotechnical/site investigations as it was utilized in volume estimation as a tool to plan extraction and removal of subsurface materials. Two case studies were presented to show this workflow. However, there are issues and complexities which need to be carefully addressed in order to make it a reliable and effective geophysical tool for this purpose.
Integrating and correlating the ERT data with boreholes and test pits seemed unavoidable as the interfaces (boundaries) between the materials to be extracted and removed and those which should be left untouched are often not well defined and difficult to interpret from the ERT images alone. The existence of 2-dimensional features further complicates the interpretation and definition of these interfaces. These interfaces need to be determined as accurately as possible as they would become the reference to determining the thicknesses of materials to be extracted and removed. Relying only on the ERT results would be risky.
References
Jamaludin, O., 2016, Projek Mass Rapid Transit Laluan 2 (KVMRT2), Sg Buloh – Serdang – Putrajaya (SSP) : Geophysical Survey – Electrical Resistivity Survey For Serdang Depot Package (unpublished)
Jamaludin, O, 2020, Package 2 – Air Hitam – Lebuhraya Tun Dr Lim Chong Eu By-Pass (Viaduct 5), Penang – 2D-ELECTRICAL RESISTIVITY IMAGING (2D-ERI) SURVEY (unpublished)
Loke, M. H, (1997, 1999), Electrical resistivity imaging for engineering and environmental studies, A Practical Guide to 2D and 3D surveys
Geotomosoft Solutions, 2015, RES2DINVx64 ver 4.05 with multi-core and 64-bit support for Windows XP/Vista/7/8/10, Rapid 2D & IP inversion using the least square methods
Author Bio

Jamaludin Othman graduated with a Bachelor of Science (B. Sc) degree in Physics (majoring in Geophysics) in 1983 from the University of Science Malaysia, Penang. He started his career as a Geophysicist with the Geological Survey Department of Malaysia (now known as the Minerals and Geoscience Department) immediately upon graduation. He was attached to the Department for 26 years before joining a Danish consulting firm in January 2009 until January 2011. He is currently the Owner/Principal Geophysicist of subMAP Geophysical Services.
He has vast experience in implementing geophysical surveys for geological mapping, groundwater exploration & geotechnical investigations. This includes designing field survey parameters, data processing & presentation, modelling, map production, interpretation and writing of technical reports. He has in-depth knowledge of geophysical techniques used for such purposes such as seismic refraction, gravity (including microgravity), transient electromagnetic (TEM) and resistivity (including 2-dimensional electrical resistivity imaging).
He has also conducted numerous training programs, mainly technical, on his field of specialization, both internally (within his former Department) and also externally. He has also presented technical papers in conferences, seminars and workshops, both locally and overseas. He has also often been invited as a speaker in courses, seminars and workshops related to the applications of geophysical techniques in various fields, such as geotechnical investigations and groundwater exploration.
He is a registered Professional Geologist with the Malaysian Board of Geologists (BOG) and a member of the Malaysian Institute of Geology (IGM). He is also currently an Adjunct Lecturer in near-surface geophysics and non-seismic methods in oil prospecting at the PETRONAS University Of Technology (UTP).
