
Shelley Cazares, Elizabeth Ayers, Katherine Fisher, Michael Tuley
Faster, Safer UXO Remediation
Thousands of formerly used defense sites and active installations in the United States are contaminated with unexploded ordnance (UXO), precluding the use of these lands for other purposes (USACE 2020). For the past several years, the Department of Defense’s Strategic Environmental Research and Development Program (SERDP) and Environmental Security Technology Certification Program (ESTCP) have funded the development of advanced geophysical classification (AGC) for remediating land and underwater sites contaminated with UXO (SERDP ESTCP n.d.). AGC is the use of advanced instruments, software, and processes to detect and classify UXO from clutter.
As terrestrial AGC began to mature in the 2000s, ESTCP launched an ambitious 10-year effort to demonstrate the performance of AGC on real sites contaminated with real munitions and explosives of concern (MEC), such as UXO (Andrews and Nelson 2011). Between 2007 and 2017, ESTCP sponsored over 20 live-site demonstrations across the United States (Cazares, Ayers, and Tuley 2018). These demonstrations were key to pulling AGC prototypes through the “Valley of Death”, a term often used to describe how promising technologies can fail to transfer to commercial use (National Research Council 2004):
- The primary goal of AGC is to detect buried objects and correctly classify them as targets of interest (TOI) such as UXO versus non-TOIs such as tools, fragments of previously exploded munitions, and other clutter. The live-site demonstrations showed that in many cases, all buried objects detected and classified as non-TOI by AGC can be left safely in the ground, potentially saving tens of millions of dollars in unnecessary excavation costs (Cazares, Ayers, and Tuley 2018).
- In the past few years, a secondary goal has emerged—the use of AGC to predict the sizes of buried TOIs to help select a more appropriately-sized minimum separation distance (MSD) between the buried TOIs and nonessential personnel during a UXO remediation project. A retrospective reanalysis of the live-site demonstrations shows that in many cases, AGC can accurately estimate the overall size of a buried TOI, informing a more appropriately sized MSD for terrestrial remediation projects (Fisher and Cazares 2019).
This article summarizes the main evidence provided by the live-site demonstrations. Over 20 terrestrial demonstrations were formally scored by an independent third party, the Institute for Defense Analyses (IDA), a Federally Funded Research and Development Center sponsored by the Office of the Secretary of Defense. IDA used well-known statistical metrics to summarize the performance of each AGC data collection/processing system at each live site demonstration. IDA then collated the metrics together across all live sites to build plots illustrating the performance of AGC over time, as technology and processes matured.
Designing and Running A Live Site Demonstration
ESTCP selected over 20 formerly used defense sites and active installations for the live-site demonstrations. Cazares, Ayers, and Tuley (2018) describe the demonstrations, including their TOI types, data-collection instruments, and participating demonstrators. Each demonstration consisted of several steps:
- Site Preparation: ESTCP first reviewed records documenting the site’s history of firing munitions and drew the boundary of each demonstration area to include a reasonable anomaly density. A quick surface clearance had already been completed to rid the demonstration area of any surface UXO, although buried UXO had been left in the ground. Surface vegetation had also been left largely intact. ESTCP then emplaced dozens of inert munitions in the demonstration area to give AGC more opportunity to detect and correctly classify TOIs. TOIs varied in size (from 20 mm projectiles to 155 mm projectiles) and shape (from cylindrical projectiles to more spherical grenades), as described in Cazares, Ayers, and Tuley (2018). Dozens of munition surrogates were also emplaced—steel pipes of the same size, shape, and wall thickness as UXO—these surrogates were also considered TOIs. Clutter items were not emplaced, since there were already thousands of clutter objects at each site. Figure 1 shows some UXO and clutter objects from a live-site demonstration.
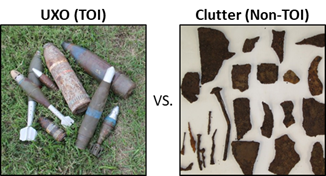
Figure 1: Inert UXO (TOIs) and clutter objects (Non-TOIs).
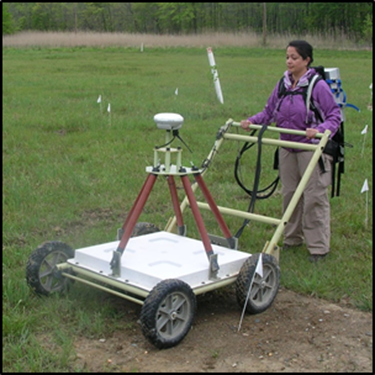
- Data Collection: Several different demonstrator teams collected data over the prepared demonstration area. All instruments were based on electromagnetic induction (EMI), discussed in Andrews and Nelson (2011) and Cazares, Ayers, and Tuley (2018). These EMI instruments ranged from the traditional, single-coil EM61-Mk2 cart to advanced, multi-coil instruments like the MetalMapper (developed by G&G Sciences and Geometrics) and Time-domain Electromagnetic Multi-sensor Towed Area Detection System (TEMTADS) (developed by the Naval Research Laboratory and Nova Research). The TEMTADS 2×2 is shown in Figure 2. The demonstrators periodically took background measurements and calibrated their instruments using a nearby instrument verification strip consisting of several different known types of TOIs, all emplaced at known positions, burial depths, and orientations.
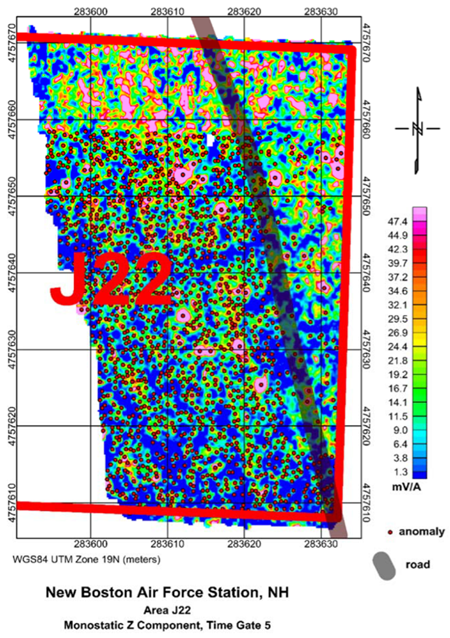
- Detection Processing: Each demonstrator used digital geophysical mapping (DGM) techniques to process different sets of data collected by different instruments and detect several thousand anomalies indicative of buried metallic objects. Figure 3 shows an example TEMTADS 2×2 DGM product. Red dots indicate detected anomalies. Each demonstrator submitted a list of their detected anomalies’ easting and northing coordinates to ESTCP.
- Intrusive Investigation: ESTCP and IDA reconciled the detection lists from all demonstrators to form one master detection list. Each anomaly on this master list was intrusively investigated to excavate, measure, and catalog the buried object(s), forming a ground-truth dataset used in subsequent scoring. This ground truth was kept hidden from the demonstrators until the very end of the demonstration.
- Classification Processing: ESTCP provided the master detection list to every demonstrator. This master list formed the basis of the next step of processing—each demonstrator was asked to independently classify the same set of detected anomalies on the same master list:
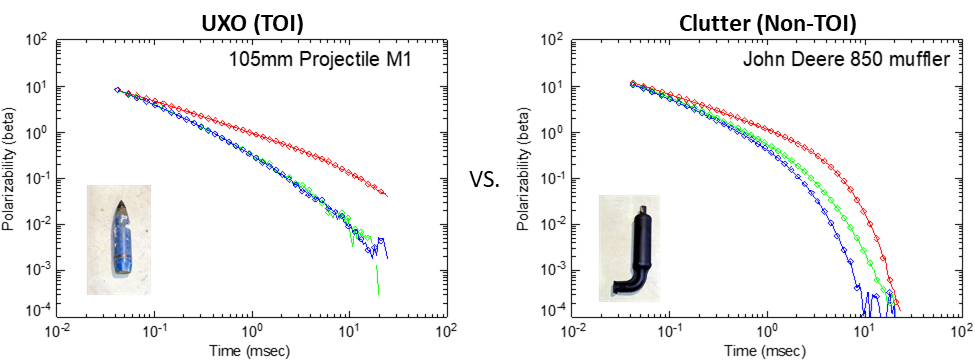
- Dipole Inversions: Each demonstrator delineated an area around each detected anomaly and fit that data to a dipole model to estimate the polarizabilities of the buried object(s). Figure 4 shows estimated polarizabilities for inert UXO and a clutter object, with each physical dimension plotted in a different color. Although the two objects were of similar physical size, their polarizabilities differed. The relative magnitudes of the polarizabilities are known to be correlated with the buried objects’ aspect ratios, while the decay rates indicate the objects’ material compositions and wall thicknesses.
- Library Matches: Each demonstrator further processed each anomaly’s estimated polarizabilities to classify the buried object, often by quantitatively comparing the estimated polarizabilities to a known library of different types of TOIs. The demonstrator organized the library match results into a ranked detection list, shown in Figure 5:
- Each list consisted of the same detected anomalies from the master list, now ordered by their likelihood of containing any type of TOI. The first anomaly on the list had the highest likelihood of containing a TOI, while the last anomaly had the highest likelihood of containing a non-TOI (a clutter object or no object at all).
- The demonstrator also provided a dig threshold for each ranked detection list. All anomalies listed below this threshold were classified as “Do Not Dig”—in a UXO remediation project, they would be left in the ground. In contrast, all anomalies above this threshold were classified as “Dig”—they would be excavated in a UXO remediation project.
- In many of the later demonstrations, the ranked detection list also specified what type of TOI, or what overall size of TOI, the demonstrator believed the buried object to be (e.g., 4.2″ mortar, M48 fuze, 37 mm projectile, etc.), often based on which TOI type the anomaly’s estimated polarizabilities best matched in the library.
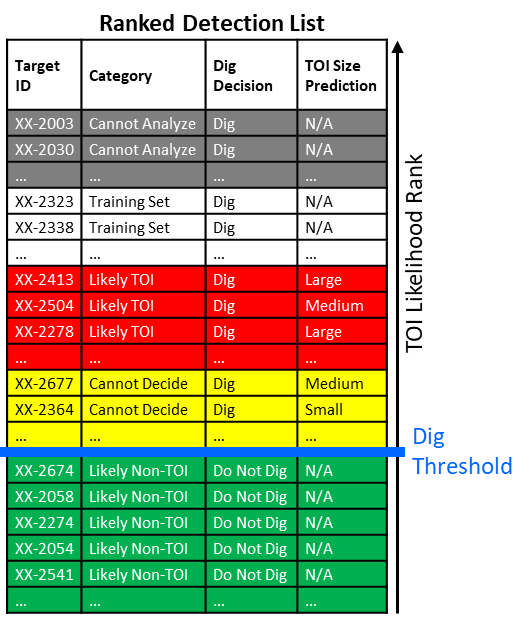
Figure 5: Excerpt of an example ranked detection list.
- Scoring: IDA generated quantitative scoring metrics for each ranked detection list:
- TOI vs. Non-TOI Classification: Each list was compared with ground truth to quantify the list’s capability of correctly classifying TOIs from non-TOIs. Scoring results were summarized in a receiver-operating characteristic (ROC) curve, shown later in Figure 6.
- TOI Size Prediction: For those lists that included the estimated type or size of the buried TOIs, a confusion matrix was used to quantify the list’s capability to predict the TOI size, shown later in Figure 8. Recently, IDA retrospectively reanalyzed these confusion matrices to determine how well AGC could help set the MSD during UXO remediation projects.
- Failure analyses/Corrective actions: Once formal scoring was complete, ESTCP released the scores and ground truth to the demonstrators. Each demonstrator performed a detailed analysis to determine the root cause of each of their false negatives (i.e., each undetected or misclassified TOI). Where possible, they recommended corrective actions. These analyses were regularly shared across the UXO remediation community via ESTCP in-progress reviews, conferences and symposiums, and published journal articles. This sharing of information and the resultant cross-fertilization of ideas proved invaluable to pushing forward the state of the art in terrestrial AGC. Many of these discussions included active participation from users, policymakers, and environmental regulators, so that they could anticipate what impact a fully mature set of AGC instruments, software, and processes could have on real remediation projects. Many of the lessons learned and shared were incorporated into a formal Quality Assurance Project Plan (QAPP) and the DoD Advanced Geophysical Classification Accreditation Program (DAGCAP) (DENIX n.d.), both of which have successfully pulled terrestrial AGC through technology transfer’s Valley of Death.
Results: Classifying UXO versus Clutter
IDA created a ROC curve to quantify the TOI vs. non-TOI classification performance of each ranked detection list. Figure 6 shows an example ROC curve from the 2012 demonstration in the tree area of the former Spencer Artillery Range. Each point of the curve corresponds to a different potential dig threshold that could have been applied to the list, plotting two metrics against each other:
- The percentage of detected TOIs that were correctly classified as “Dig” versus
- The number of detected non-TOIs that were incorrectly classified as “Dig” (i.e., the number of false alarms). This number can be multiplied by the dollar cost per dig (e.g., $50 per dig) to arrive at what would be the total unnecessary costs of excavating the false alarms, had the demonstration been a real UXO remediation project.
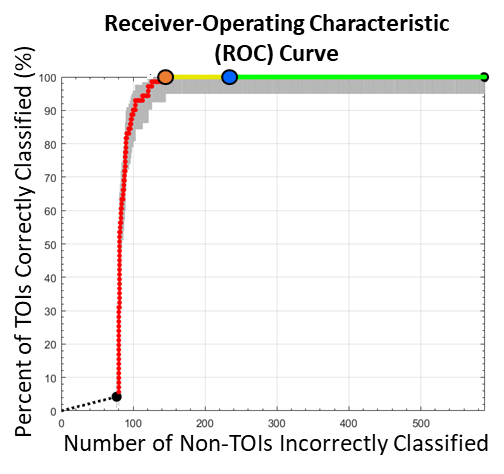
Figure 6: A ROC curve quantifying the TOI vs. non-TOI classification performance of a ranked detection list. The blue dot is the dig threshold selected by the demonstrator. The orange dot indicates the perfect dig threshold.
The ROC curve flags some key potential dig thresholds:
- The large blue dot indicates the dig threshold selected by the demonstrator. In the case of Figure 6, the demonstrator’s dig threshold could correctly classify 100% of the detected TOIs while producing 234 false alarms (non-TOIs incorrectly classified).
- The large orange dot indicates, with 20/20 hindsight, what would have been the “perfect” dig threshold—that which would have produced the fewest false alarms while correctly classifying 100% of the detected TOIs.
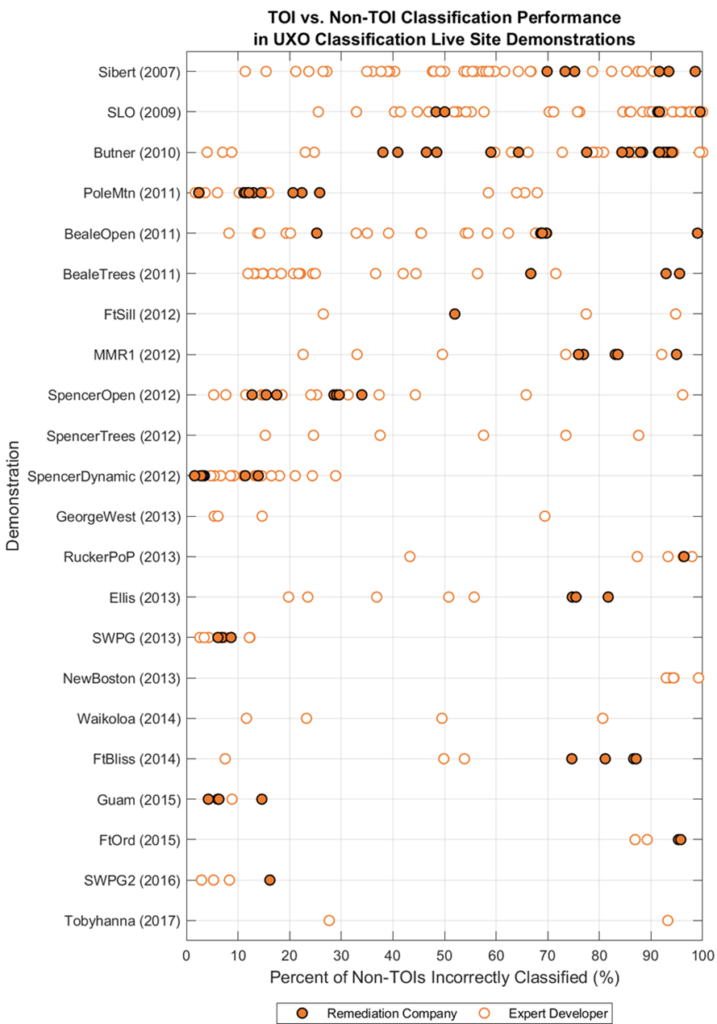
Figure 7 summarizes all ROC curves scored from all ranked detection lists submitted for all live-site demonstrations. Each point refers to one ranked detection list formally scored by IDA between 2007 and 2017. The demonstrations are arranged in chronological order down the vertical axis, while the horizontal axis plots the position of the large orange dots on the ROC curves, now normalized as percentages of non-TOIs incorrectly classified. The overall performance of each ranked detection list can be summarized by how far to the left its orange dot lies. An orange dot far to the left indicates good classification performance—only a small percentage of non-TOIs must result as false alarms to correctly classify 100% of the TOIs.
Early demonstrations showed a wide range of classification performance, while later demonstrations often showed either consistently good (toward the left) or consistently poor (toward the right) performance. This bifurcation of results was particularly notable, since later demonstrations were intentionally designed to be increasingly challenging, typically including smaller, more varied TOIs and more difficult terrain. Despite these challenges, by 2012, most demonstrators at many sites (e.g., SpencerOpen, SpencerDynamic, GeorgeWest, SWPG, Guam, SWPG2) could correctly classify 100% of the TOIs while incorrectly classifying less than 30% of the non-TOIs. However, for a few sites (e.g., FtSill, MMR1, RuckerPoP, NewBoston, FtOrd), results were more limited.
These varied results allowed ESTCP to better understand (and communicate to stakeholders) which types of sites are better suited for AGC. For example, results showed that AGC is not appropriate for sites with a very high prevalence of TOI (e.g., NewBoston). Results also showed that while AGC could be challenged by small, varied munition types (e.g., FtSill, MMR1, RuckerPoP, FtOrd), it could still be useful for more directed goals, such as correctly classifying large, shallow munitions (e.g., FtOrd) and large munitions with unexpended explosive material (e.g., MMR1). Furthermore, some demonstrators could still achieve success on sites with dense tree coverage causing challenges for GPS geolocation (e.g., BealeTrees, SpencerTrees) and a high background noise floor causing challenges for anomaly detection (e.g., Waikoloa, Guam).
Results: Predicting the Size of UXO
In the last few years, IDA has retrospectively reanalyzed the live-site demonstration scores to explore the capability of AGC in predicting the size of a buried TOI. Starting in 2012, the demonstrators often provided extra information on their ranked detection lists, including the predicted sizes or types of the buried TOIs (e.g., 155 mm projectile, 4.2″ mortar, M48 fuze, 37 mm projectile, etc.). IDA binned these predictions into three TOI size bins:
- Small (diameter less than 50 mm),
- Medium (diameter greater than or equal to 50 mm and less than 100 mm), and
- Large (diameter greater than or equal to 100 mm).
Each list’s TOI size bin predictions were compared with ground truth to produce a confusion matrix. Figure 8 shows an example confusion matrix from the 2012 demonstration at the Massachusetts Military Reservation. Each box tallies the number of detected anomalies that corresponded to the TOI size ground truth row and the prediction column.
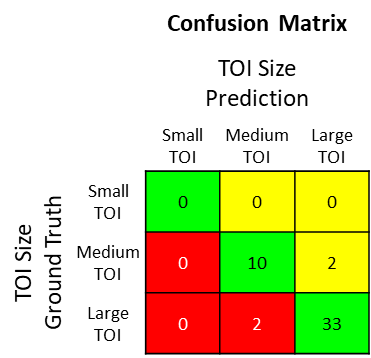
In some cases, the sizes of the TOIs were accurately predicted (green). In other cases, the TOI size prediction was larger than needed (yellow), erring on the side of caution. Assuming a correlation between TOI size and explosive hazard, an MSD based on these yellow size predictions would have been unnecessarily large, leading to unnecessary evacuation costs in a UXO remediation project. In still other cases, the TOI size prediction was too small (red), which could have resulted in an MSD that was smaller and less safe than needed.
Figure 9 summarizes the TOI size prediction performance of all ranked detection lists that were submitted with the necessary TOI type or size estimates. Each plot corresponds to one demonstration, and each bar of each plot corresponds to one ranked detection list. For example, four lists were submitted at Camp George West, leading to four bars in the first row/last column plot. Color shadings refer to the percentage of TOI size predictions that were correct (green), too large (yellow), and too small (red). Overall, 90% (5,065 out of 5,637) of the TOI size predictions across all 12 demonstrations were correct; 7% (416 out of 5,637) were too large, erring on the side of caution; and just under 3% (156 out of 5,637) were too small and potentially unsafe.
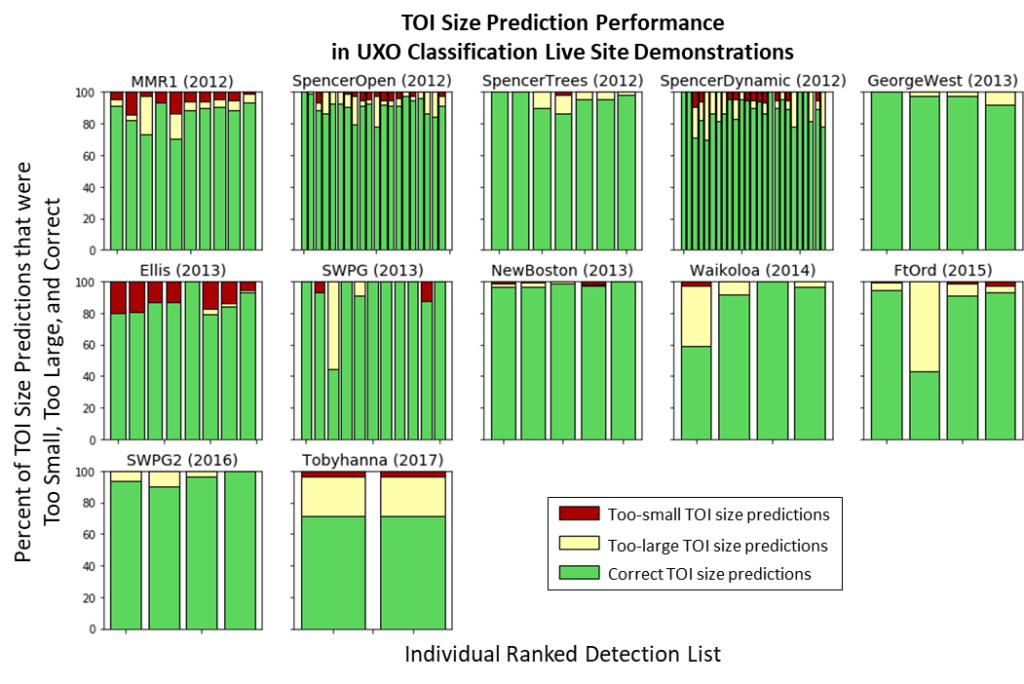
Figure 9: TOI size-prediction performance for all ranked detection lists formally scored for later live-site demonstrations.
IDA further analyzed the 156 too-small predictions. Only one was wrong by two size categories—a large object that was predicted to be small. This prediction involved a very large TOI (155 mm projectile) that was buried rather deep (52 cm) at Fort Ord in 2015. This particular error was made by a UXO remediation company new to AGC; this demonstration was the company’s very first time using AGC at this scale. Three other demonstrators correctly predicted the size of this particular TOI. In retrospect, more training or better quality control may have avoided this error.
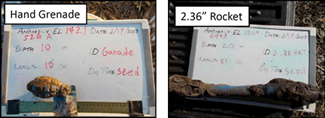
Furthermore, out of the 156 too-small predictions, 88 involved truly medium-size TOIs that were predicted to be small. A total of 36 of these predictions were grenades, all of them at the former Camp Ellis Military Reservation in 2013. In this analysis, the ground-truth TOI size bins were based on the diameters of the TOIs, rather than their overall sizes. Figure 10 shows two representative TOIs from the former Camp Ellis: a grenade (left) with a diameter of roughly 60 mm and a 2.36″ rocket (right), also with a diameter of approximately 60 mm (2.36″ ≈ 60 mm). Grenades are much smaller overall than rockets. However, they were both placed in the same medium ground-truth size bin, due to their similar diameters. Relabeling the ground truth of the grenades from medium to small would have slightly improved the overall TOI size-prediction scores.
Lessons Learned
The UXO classification live-site demonstrations were a story of success. They provided hard, quantitative evidence that, in many cases, AGC can correctly classify and predict the sizes of TOIs, allowing remediation teams to focus on the excavation of explosive hazards with appropriately sized MSDs while reducing the costly and unnecessary excavation of non-explosive clutter. The demonstrations provided high-quality, ground-truthed data that guided the development of instruments, software, and processes to document, aid, and often automate a geophysicist’s classification decision-making during a UXO remediation project, providing regulators with the formal documentation they need to allow the land to be used for other purposes. As experience was gained and technology matured, the demonstrations were intentionally designed to be increasingly challenging, allowing stakeholders to explore the types of sites where AGC is and is not appropriate.
Performance improvements occurred over time, likely due to steady advances in AGC instruments, software, and processes. Later demonstrations included more advanced instruments with multiple transmit and receive coils that can “illuminate” a buried metallic object from multiple orientations, providing more high-resolution data that can better support classification. Also, later demonstrations included more advanced software that employed multi-source, rather than single-source, dipole inversions to resolve multiple, closely spaced objects. Advanced software in later demonstrations also included more comprehensive polarizability libraries of a wider range of TOIs. Finally, later demonstrations incorporated the lessons learned from the earlier demonstrations. As the years progressed, many quality-assurance and quality-control processes were formulated to catch errors early, resulting in high-quality data to support detection and classification of smaller, deeper, and more closely spaced objects. These processes have now been rolled up into a formal DAGCAP and QAPP to accredit and guide commercial companies on the use of AGC for UXO remediation, providing regulators with the formal documentation they need.
All of these lessons were hard earned. The live-site demonstrations were more than just dog and pony shows. They included careful data collection and processing, rigorous scoring, painstaking failure analyses, collective head scratching across the community, and spirited debates between developers, users, policymakers, and regulators. All of it was worth it: terrestrial AGC has now walked through the Valley of Death and made it out the other side.
References
Andrews, Anne, and Herb Nelson. 2011. Implementing Advanced Classification on Munitions Response Sites: A Guide to Informed Decision Making for Project Managers, Regulators, and Contractors. Alexandria, VA: SERDP ESTCP. https://serdp-estcp.org/content/download/12780/151578/file/Implementing_Classification_on_Munitions_Response_Sites_FR%20with%20Appendix%20A.pdf.
Cazares, Shelley, Elizabeth Ayers, and Michael Tuley. 2018. ESTCP UXO Live Site Demonstrations 2007 to 2017. IDA Document D-9193. Alexandria, VA: Institute for Defense Analyses.
DENIX. No date. “Advanced Geophysical Classification Accreditation and Other Tools.” https://www.denix.osd.mil/mmrp/advanced-geophysical-classification-accreditation-and-other-tools/
Fisher, Katherine and Shelley Cazares. 2019. “Assessing the Capability of Advanced Geophysical Classification Techniques to Inform Minimum Separation Distances for UXO Remediation.” IDA Document NS D-10951. Alexandria, VA: Institute for Defense Analyses. Presented at the SERDP ESTCP Symposium 2019, Washington DC, December 3–5.
Klaff, Tamir. 2015. “Empirical Evaluation of Advanced Electromagnetic Induction Systems – Factors Affecting Classification Effectiveness in Challenging Geologic Environments, New Boston Air Force Station, NH.” ESTCP Project MR-201314. CH2M Hill. https://www.serdp-estcp.org/content/download/33449/325362/file/MR-201314-TR.pdf.
National Research Council. 2004. Accelerating Technology Transition: Bridging the Valley of Death for Materials and Processes in Defense Systems. Washington, DC: The National Academies Press. https://doi.org/10.17226/11108.
SERDP ESTCP. No date. “Munitions Response.” Fact sheet. https://serdp-estcp.org/content/download/51899/510776/file/MR%20Fact%20Sheet.pdf.
Steinhurst, Daniel, Glenn Harbaugh, Jim Kingdon, and Tom Bell. 2008. “MTADS Time-Domain EMI Sensor System for UXO Classification.” Presented at the Partners in Environmental Technology Technical Symposium, Washington DC, December 2–4.
USACE. 2020. “Formerly Used Defense Sites Program Fact Sheet.” https://www.usace.army.mil/Media/Fact-Sheets/Fact-Sheet-Article-View/Article/1910599/formerly-used-defense-sites-program-fact-sheet/.
Author Bios
Shelley Cazares
Shelley Cazares is a Research Staff Member at the Institute for Defense Analyses (IDA). Her research focuses on machine learning and computational modeling to reduce collateral damage in military scenarios. She designed the scoring process for the 2007-2017 ESTCP terrestrial live site demonstrations and the subsequent accreditation program (DAGCAP), and is currently leading the effort to score blind tests for underwater UXO demonstrations. Prior to joining IDA, she was a Principal Research Scientist at Boston Scientific Corporation, where she designed novel algorithms for implantable cardiac devices to autonomously diagnose and treat heart disease. She earned her doctorate in Engineering Science from the University of Oxford in the Signal Processing and Neural Networks research lab and her bachelor’s degree in Electrical Engineering & Computer Science from MIT.
Elizabeth Ayers
Elizabeth Ayers assisted with the scoring procedure for the 2007-2017 ESTCP live site demonstrations as a Research Associate at the Institute for Defense Analyses (IDA). Her primary area of research includes target detection, recognition, and classification using ground-penetrating radar, infrared and visible sensors, and metal detectors. She received a Master of Science in Chemical Physics and a Bachelor of Science in Physics at University of Maryland.
Katherine Fisher
Katherine Fisher is a Research Staff Member at the Institute for Defense Analyses (IDA). Her research focuses on analyzing complex and unstructured data types. She assisted with a retrospective analysis of the 2007-2017 ESTCP terrestrial live site demonstrations. Prior to joining IDA, she was the Lead Bioinformaticist at Chromologic, where she developed algorithms for detecting very small biomolecules to aid the design of medical tests and devices. She earned her Ph.D. in Systems Biology from Caltech and her bachelor’s degree in Biology from The College of William and Mary.
Michael Tuley
Michael Tuley earned a BEE from Auburn in 1966 and an MSEE from Georgia Tech in 1972. After five years of service as a nuclear qualified, submarine officer and graduate school, he joined the Georgia Tech Research Institute (GRTI) where he participated in and directed radar-related programs, with a focus on Radar Cross Section Reduction and radar detection modeling. Since 1998, he has been a Research Staff Member at the Institute for Defense Analyses (IDA), where he has supported a wide range of sensor and surveillance programs, including the 2007-2017 ESTCP terrestrial live site demonstrations. He is a coauthor of Radar Cross Section (1st and 2nd editions), and authored chapters in two additional books on Radar measurement techniques. He is a Life Fellow of the IEEE.
