
R.D. Hewson / Mark van der Meijde / Harald van der Werff / Christoph Hecker / Wim H. Bakker / Frank van Ruitenbeek
Abstract
Recent improvements and availability of optical to infrared to thermal satellite and airborne sensors opens up the opportunity for advancing surface mineralogy and geological mapping. Such mapping may include the identification of alteration zones for exploration activities or monitoring ore quality and inventory within open cuts. Remote sensing technology is also on the cusp of major new developments with deployment of hyperspectral sensor satellites, UAV/drones and proximal mine face sensors. Such imagery will provide additional compositional information within the geoscientists tool kit for regional to mine site scale studies. In particular the improvement and access of higher spectral and sometimes, spatial resolution will assist the mapping of different AlOH, MgOH, carbonate, sulphate and iron oxide mineral identities, potentially related to phyllic, propylitic and argillic alteration zones. Integration of such remote sensing map products with regional geophysical data and other geoscience information has in the past and will in the future refine and improve its interpretation. Satellite imagery and large-scale airborne survey acquisitions can be particularly useful for greenfields exploration in exposed terrain within arid to semi-arid remote areas. UAV/drone platform remote sensing is increasingly being applied to brownfields open cut observations and mine site environmental monitoring. However, an understanding of the caveats and limitations on remote sensing is essential. In particular, knowledge of the issues of sensor resolution, and illumination, atmospheric and ground conditions at the time of acquisition is important. This paper aims to provide a brief overview of current available remote sensing technologies, a cross section of related case studies, and a roadmap strategy for undertaking geological remote sensing applications.
Introduction
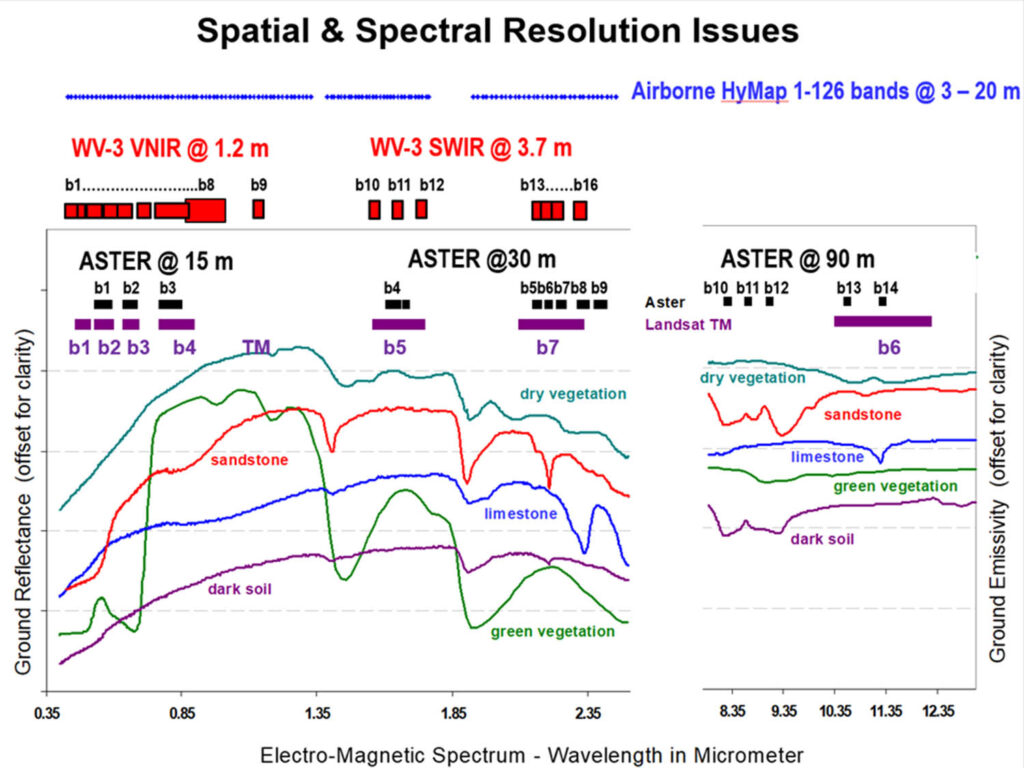
Remote sensing technology is a fast-moving field for surface observations and interpretation of the terrestrial environment. In particular, the accessible civilian sensors, the platforms they observe from, and the applied algorithms / software have come a long way since the early four band visible observing days of ERTS/MSS Landsat in the 1970s [https://landsat.gsfc.nasa.gov/]. Multiple wavelength regions can now be observed by “hyperspectral” sensors with over 100 bands Meer et al. (2012). Each sensor band is designed to record the reflected light or emitted heat from the surface at different wavelengths of the Electromagnetic Spectrum. The improvement in the modern sensors for their spectral resolution (e.g. number of bands and their bandwidth) enables greater confidence in the interpretation of diagnostic mineral features observable within the visible-near infrared (VNIR), shortwave infrared (SWIR) and the thermal infrared (TIR) wavelength regions. Higher spatial resolution (e.g. finer image pixels) provided by modern sensors also improves their ability to delineate narrow geological features such as dykes and structures. It can also reduce the issue of “spectral mixing” where each image pixel potentially observes the combined signatures from rock outcrops, soil, green and dry vegetation. However, a compromising engineering result of higher resolution sensors is the potential reduction in the Signal to Noise Ratio (SNR) which can counteract the benefits of both higher spatial and spectral information.
There has also been an incredible growth in the number and type of platforms available for remote sensing to be undertaken since the early satellite borne Landsat sensors [https://landsat.gsfc.nasa.gov/]. Several satellite platforms with sensors also useful for geologists, have followed Landsat Thematic Mapper (TM), including ASTER (Advanced Spaceborne Thermal Emission Reflection Radiometer) (Abrams & Yamaguchi, 2019) [https://asterweb.jpl.nasa.gov/] and WorldView-3 (Kruse et al. 2015) [https://www.maxar.com/constellation] (Figure 1). Such satellite sensors are regarded as “multi-spectral” with less than 20 bands recording within the VNIR, SWIR and TIR wavelength regions. The acquisition timing of such multi-spectral satellite sensors generally occurs between 10 am to midday local time. The Sentinel-2 (Meer et al., 2014) and Landsat missions [https://landsat.gsfc.nasa.gov/] have been designed to regularly re-acquire imagery over the same ground. However, ASTER’s acquisition policy was to acquire imagery under optimal seasonal and cloud-free conditions within its effective 2000-2007 combined VNIR-SWIR-TIR operating life (Abrams & Yamaguchi, 2019).
The practical benefits of undertaking higher resolution regional geological reconnaissance or detailed mineral mapping has also encouraged the development of several airborne platforms with hyperspectral sensors recording radiance measurements from the VNIR, SWIR or TIR wavelength regions. Commercial hyperspectral airborne sensors acquiring imagery within these mineralogically diagnostic wavelengths include HyVista’s HyMap [http://www.hyvista.com/], SpecTIRs’ AisaOWL & AisaFENIX [https://www.spectir.com/], and ITRESs’ CASI, SASI and TASI [https://www.itres.com/]. Such airborne surveys could then be mobilized for optimal seasonal and ground conditions, weather permitting (?!). A useful review of geological remote sensing and both multi-spectral and hyperspectral sensors, up to 2012, is provided by Meer et al. (2012).
A new and promising development of sensor platforms for geological applications has been the Unmanned Airborne Vehicles (UAVs) or drones. This is a fast-changing technology scene, offering the ability to carry multi-spectral, and recently, hyperspectral sensors for domestic, agricultural/environmental and geological observations. The early limited payload carrying capacity of such UAVs initially were restrictive for such sensors in the early 2000s. However, as sensor engineering and drone capacity improved, the scope for short duration (e.g. 20 to 60 minutes) ultra-high spatial resolution multi- to hyperspectral sensor observations has become possible. Such high spatial resolution and accurately controlled low altitude image acquisitions lend themselves for mining activities (e.g. “brown fields”) involving mineral related ore quality control analysis and inventory volume monitoring. Another theatre for detailed geological or mineralogical remote sensing is with the use of ground based proximal sensors, typically directed at mine pit walls or outcrop surfaces. Such sensors are typically hyperspectral and high spatial resolution for very detailed mineral mapping.
The aim of this overview is to provide a brief introduction to geological remote sensing as a broad summarized roadmap example of possible steps that can be followed towards generating geologically and/or mineralogically related compositional maps. The case studies described are a small cross section sample of publications that can demonstrate this aim. The examples of sensors, either as satellite borne, airborne, UAVs or proximal are in no way intended to be comprehensive but to provide a starting step for a remote sensing geoscientist practitioner in the 2020s.
Mineral detection vs sensor
One of the key questions an exploration or mining geologist/geophysicist needs to ask themselves when deciding the applicability of remote sensing for a particular problem is to strictly define the surface mineralogical or geological target(s). Defining this will enable the follow-on questions regarding, what wavelength region and sensor resolution is required. What is the likely target surface exposure? Answering these questions will help establish the type of sensor, the platform and consequently the cost of image acquisition(s).
Several decades of laboratory-based spectroscopy within the VNIR, SWIR and TIR wavelength regions have established the ability to identify, or at least discriminate minerals and mineral groups. In particular, the ferric oxide group (e.g. hematite and goethite), the OH- bearing phyllosilicates (e.g. clays, micas, chlorites) and other silicates have been shown to display diagnostic signatures within the VNIR, SWIR and TIR wavelength regions, respectively (Sherman 1985; Clark et al. 1990; Grove et al. 1992; Salisbury & D’Aria 1992). In addition, carbonate and some sulphate minerals have spectral absorption features both within the SWIR and TIR wavelength regions (Grove et al. 1992; Salisbury & D’Aria 1992). Such spectral signatures exhibit absorption features whose depth in reflectance values (or emissivity within the TIR) can be approximately related to abundance or content of that mineral. Some mineral signatures (e.g. muscovite) also demonstrate shifts in the wavelength of their absorption reflectance minima (approximately 2.2 um) associated with compositional chemistry changes. Such inferred compositional changes of mica can be relevant for the interpretation of their possible metamorphic or alteration history (Duke 1994).


(a) USGS Lab spectra (solid) vs Landsat 8 OLI (square symbols) (b) ASTER (astericks) vs WV-3 (squares) (c) Sentinel-2 (triangles) vs HyMap (solid)
The latest online accessible USGS spectral library provides laboratory level high spectral resolution measurements of pure mineral specimen signatures within the VNIR-SWIR region (Kokaly, et al., 2017) [https://www.usgs.gov/labs/spec-lab/capabilities/spectral-library]. Both the older USGS VNIR-SWIR and also the Johns Hopkins University TIR mineral spectral libraries are described and accessible via the ASTER/ECOSTRESS website (https://speclib.jpl.nasa.gov/)
Examples of the USGS Laboratory VNIR-SWIR signatures for calcite, muscovite, chlorite, and the iron oxides hematite and goethite, are displayed in Figure 2 a) (Kokaly, et al., 2017). The same mineral signatures were resampled to simulate the resolution equivalent to Landsat 8 OLI (Figure 2a); ASTER and WV-3 (Figure 2b), and the Sentinel-2 and HyMap sensors (Figure 2c). It is apparent that the Ferric iron oxide minerals, hematite and goethite, are best discriminated by their 0.7 to 1.0 um VNIR features at the hyperspectral resolution. However, to a some extent, Sentinel-2 (Meer et al., 2014) and WV-3’s multi-spectral VNIR bands and resolution can resolve a shift of the VNIR 0.8 to 0.9 um FeOx spectral features to longer wavelengths, related to the hematite to goethite composition respectively (Figures 2 b & c). Figures 2 b) & c) show that ideally the carbonate mineral, calcite, requires the more complete SWIR wavelength spectrum that includes its 2.25 to 2.4 um absorption feature measured by the HyMap and ASTER sensor. However, confusion between calcite and chlorite can still be an issue using the lower resolution ASTER unless the Ferrous Iron composition within chlorite is observed from the spectral “ramp” running from 2.0 to 1.0 um. WV-3 lacks the band 9 of ASTER at 2.4 um and shows only one of the reflectance “shoulders” of the calcite and chlorite absorption features at 2.33-2.35 um (Figure 2b). Again, having access to a hyperspectral resolution sensor enables the potential to distinguish their more subtle features such as chlorite’s minor 2.25 um absorption feature. The muscovite 2.2 um absorption feature is typical for several AlOH or clay phyllosilicate signatures (e.g. montmorillonite, kaolinite, illite) and can be observed by the HyMap, ASTER and WV-3 sensors. However, the limitation of only one SWIR band acquired by Landsat and Sentinel-2 is an obvious handicap in confidently identifying such potentially argillic alteration associated minerals (Figures 2 a & c).
Spatial resolution can also be a critical factor in the decision of the appropriate sensor and imagery to use, depending on the geological and alteration target. Traditionally multi-spectral satellite sensors (Landsat TM, ASTER VNIR-SWIR) used by geologists have been acquired at 30 m resolution. Comparison between AlOH map products generated from ASTER’s 30 m and HyMap’s 3.5 m imagery over Broken Hill shows the benefits of higher spatial resolution in areas with narrow bedding or shear zones, if that is an important survey target criteria (Hewson et al. 2005). New generation satellite sensors such as Maxar’s WorldView-3, launched in 2015, now offers 1.2 m VNIR and 3.7 m SWIR imagery [https://www.digitalglobe.com/]. In a study over the exposed geology of Death Valley using several airborne hyperspectral VNIR-SWIR acquisitions over time, Kruse (2000) demonstrated that there were clear benefits in geological mapping from a higher spatial resolution (e.g. < 20 m), assuming a reasonable SNR image quality (e.g. > 100-200:1) is achievable.
Making it happen
Having decided the mineral(s) of interest for a study of the surface composition and appropriate sensor(s) to use, the format of the imagery or the data level of the imagery needs to be chosen. Most satellite image suppliers list online possible data levels from Level 1 (raw/unprocessed or calibrated “radiance at the sensor”) to Level 2 (typically atmospherically and geometrically corrected surface reflectance for VNIR-SWIR or emissivity for TIR). Some suppliers such as USGS’s LPDAAC [https://lpdaac.usgs.gov/] also provide orthorectified radiance data (Level 3) that has an terrain correction applied using DEMs and is useful for areas with significant topographic relief. The example of the LPDAAC supplied ASTER data levels and their explanations is available via https://asterweb.jpl.nasa.gov/data_products.asp. Generally, suppliers of airborne VNIR-SWIR hyperspectral imagery these days, supply geometrically corrected surface reflectance data. Hyperspectral TIR imagery is not so widely acquired as VNIR-SWIR, although very useful for mapping silicates (e.g. quartz, feldspars, garnets, pyroxenes) and carbonates. Such TIR imagery can be more challenging for separating temperature effects from the diagnostic emissivity signatures and other atmospheric effects, such as indirect “downwelling” radiance contributions.
Once the imagery data level is chosen (ideally surface reflectance or emissivity), downloaded and/or acquired, the processing and extraction of the mineral, or mineral group, information can be undertaken. There is almost a minefield (no pun intended) of different processing techniques, and the choice is partly affected by the mineral(s) or lithological unit target(s), and partly whether its multispectral or hyperspectral imagery. Another deciding factor may be the availability of affordable image processing software. Processing by remote sensing consultants may offer an option to extract the geological / mineralogical information using their own specialized software. Such specialized software may include ERDAS-IMAGINE [https://www.hexagongeospatial.com/products/power-portfolio/erdas-imagine] or ENVI [https://www.harris.com/solution/envi]. ERDAS software can also include the installation of ER Mapper software, used by geophysicists widely in the past, and has GIS and data integration facilities. Multi-spectral imagery is also easily handled and processed by ERDAS IMAGINE/ER Mapper. ENVI has many powerful image processing capabilities included for hyperspectral imagery and its comparison / integration with laboratory or field acquired spectral signatures. Cost can be a factor for such specialized software. Options may include the example by the ENVI supplier L3Harris for short term academic or commercial ENVI licensing for as short as 1 month to 1 year (alternatively available as perpetual academic or commercial licenses).
Other software processing options may also include public domain software such as QGIS, combining GIS integration with processing options, for multi-spectral imagery (e.g. ASTER, Sentinel-2, WV-3). QGIS requires the public domain software language, Python [https://www.python.org/] and offers the possibility of user designed algorithm programs as plugins into QGIS. Other examples of public domain software include the ITC (University of Twente) HypPy software [https://blog.utwente.nl/bakker/hyppy/], that also runs on Python. HypPy (Hyperspectral Python) has several band math, display and logic options, useful for multi-spectral imagery. One of its key capabilities is polynomial curve fitting to any spectral absorption features detected within hyperspectral imagery, and matching them with depth and wavelength parameters as a way to extract estimates of mineral abundance and composition. It requires the imagery to be in ENVI data format, which is also possible via QGIS or GDAL [https://gdal.org/] operations. Further details on its operation and case study examples are described in Hecker et al. (2019).
A new paradigm in image processing is the use of online development platforms. These platforms give access to cloud computing services, linking to several data archives with remote sensing imagery and other geospatial data. Examples of popular platforms are ‘Google Earth Engine’, ‘OpenDataCube’ and Sentinel-Hub; a complete listing is given in Gomes et al., (2020).
Mineral (& lithology) mapping
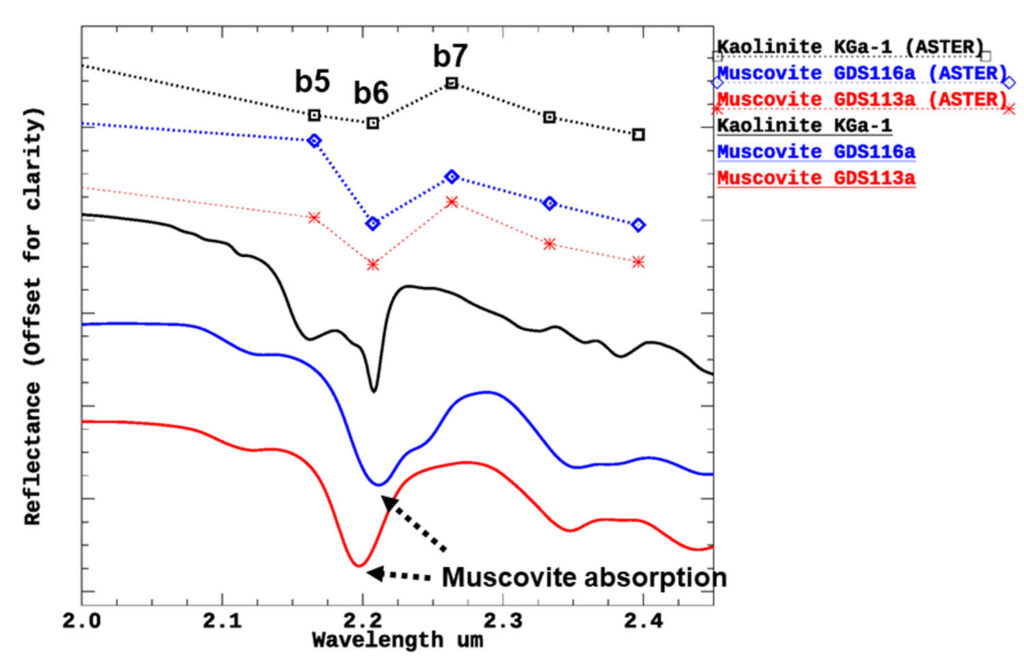
The choice of available software influences the type of type of processed mineral map products, as well as the above-mentioned decisions of sensor resolution and data level format. Processing of multi-spectral imagery has often involved band math or ratio operations applied on the various sensor bands to generate indices that qualitatively to semi-quantitatively represent mineral abundances. One particular band math operator often used is the Relative Band Depth (RBD) that highlights the target mineral absorption feature using three bands, one band at a wavelength known to be close the mineral absorption feature, and the other two bands chosen on the shoulders of the absorption feature (Figure 3) (Crowley et al. 1989). The simplest version of the RBD operator can be demonstrated with the ASTER RBD expression for muscovite abundance (Figure 3) using the equation:
(R5 + R7) / R6
where R5, R6 and R7 are the surface reflectance ASTER band values for bands 5 (2.17um), 6 (2.21um) and 7 (2.26um) respectively (Figure 3). The wavelengths shifts shown for the 2.2 um muscovite feature, can be caused by changes in chemistry and related structure of the mica, particularly from the Al content. This may be an important observation for interpreting possible alteration and hydrothermal influences, as mentioned above (Duke, 1994). Several band ratios can be designed using ASTER bands 5, 6 and 7 to qualitatively interpret these Al changes in muscovite, as well discriminate from kaolinite (Figure 3). One such qualitative ASTER image product to distinguish AlOH mineral differences can be achieved using the Red Green Blue color composite
e.g. RGB : R5 / R6 ; R7 / R6 ; R7 / R5
Similar RBD and band ratio operators can be designed using WV-3, and also using hyperspectral imagery. Examples of these and other band math multi-spectral algorithms for mineral and/or mineral group map products are described in Rowan and Mars (2003), Mars and Rowan (2006), Hewson et al. (2005), Meer et al., (2012) and Cudahy (2012). Ninomiya et al (2006) has also devised band math operators using ASTER’s TIR bands 10-14 for silicate lithology mapping, incorporating more bands related to the overall spectral signature shape.
There are also many processing options for generating geological map products from hyperspectral VNIR-SWIR and TIR imagery. As well as equivalent hyperspectral band versions of RBDs and other band math operators described above, Spectral Angle Mapper (SAM) and spectral unmixing or Matched Filtering/Mixture Tuned Matched Filtering (MTMF) are commonly used for the entire VNIR-SWIR or TIR image signatures (Kruse et al., 1993). These and many other algorithms are available in ENVI software. Such algorithms require the input of an assumed target mineral signature, present in the imagery, derived from the imagery itself (e.g. “endmember”), or from a lab/field derived mineral spectral library. Examples of unmixing imagery from both ASTER and the airborne hyperspectral NASA sensor, AVIRIS, are described in Rowan and Mars (2003). In particular their study shows that by utilizing the entire VNIR-SWIR spectrum, rather than an individual mineral absorption feature (e.g. via a RBD index), it is possible to map different lithologies containing several minerals and their associated spectral features.
Caveats & Pitfalls
The successful application of remote sensing techniques for geological mapping requires a respect of the limitations generated by the atmospheric / illumination conditions, ground moisture, weathered / transported cover, and of course (our friends?), the green and dry vegetation. The correction of the satellite acquired “radiance at the sensor” to surface reflectance or emissivity has tended to be undertaken in the past by atmospheric modelling software, based on MODTRAN [http://modtran.spectral.com/] using seasonal and latitude user inputs. Increasingly, spectral bands are now included in the design of multi-spectral satellite sensors to estimate moisture and sometimes aerosol concentration at the time of acquisition (e.g. WV-3, Sentinel-2). Hyperspectral VNIR-SWIR sensors typically already have bands at particular wavelengths that can be used for in-situ atmospheric corrections. However, both the default modelled and in-situ corrections are not perfect and the goal of deriving absolute reflectance imagery for comparison with spectral libraries is difficult to achieve. Apparent reflectance imagery with consistent and sensible relative values between bands showing recognizable mineral spectral signatures is, however, achievable but not guaranteed. Users of reflectance level imagery should be aware of the possible atmospheric artifacts particularly when humidity or smoke are present. Distortions in the lower wavelength visible bands can occur from aerosol (e.g. smoke) scattering (e.g. ~<0.6 um). Increased humidity, particularly during warmer seasons, reduces the transmission and reflection of the solar radiation making the modelling or in-situ corrections more difficult and results a lower effective SNR. Acquiring imagery at the highest sun angles is optimal and may limit the surveying time during winter months depending on the latitude. This issue can be more difficult in areas of topographic relief. Using DEMs to model the extent of such shading at the expected acquisition times is possible using image processing software (e.g. ERDAS IMAGINE/ER Mapper; ENVI). Ground moisture is also an issue and local weather stations should be accessed to assess the possibilities of rainfall before the satellite or airborne data acquisition. Moisture content within the surveyed soils or rock outcrops will reduce the reflected spectral contrast of mineral absorption features and possibly make their discrimination or detection more difficult. Another ground surface issue is the nature of the surface, whether it be weathered and unrepresentative of the fresh units, or composed of transported alluvial, colluvial or aeolian cover. A great deal of research has been undertaken within the often deeply weathered Archean cratons of Australia studying the “regolith” [http://crcleme.org.au/]. Residual weathered minerals such as Ferric Iron Oxides, kaolinite and quartz often dominate the surface. However, with sufficient spectral resolution, subtle changes observed in the kaolinite 2.16-2.2 um absorption feature can indicate whether the ground surface is exposed outcrop or regolith / transported cover (Cudahy, 2016). Vegetation cover is an obvious handicap particularly if it is forested or even open woodland with shadowing. The chlorophyll green vegetation features within the VNIR (0.5 – 0.85 um; Figure 1) not only obscure any exposed geology but their spectral features will potentially complicate the interpretation of iron oxide spectral signatures (0.6 – 1.1 um; Figure 2a). Dry vegetation containing cellulose also has a broad spectral feature and characteristic signature (2.0-2.3 um, Figure 1) that can also complicate the interpretation of the important clay mineral features (2.1-2.25 um, Figure 2a). Note that it’s not only dry leaf litter or bark that may produce such an interfering SWIR signature as lichen growing over outcrops also has a cellulose signature. Green vegetation cover is sometimes dealt with by generating masks from the VNIR imagery which effectively exclude or mask those pixels which produce higher levels of the band ratio/math map products related to the chlorophyll “Red Edge” (e.g. 0.75-0.85 um; Figure 1). This vegetation mask may consist of ASTER Band 3/Band 2 > 1.4 (Cudahy, 2012). Alternatively, a mask can be produced from the Normalised Difference Vegetation Index (NDVI, Myneni et al, 1995) > 0.4 (Hewson et al., 2020). NDVI can be calculated almost from all standard VNIR-SWIR sensors using the bands: Red (~0.65 um) and IR (~0.8 um). For ASTER: NDVI = (R3 – R2) / (R3 + R2)
where R2 and R3 are the ASTER image reflectance’s of bands 2 and 3. Image pixels with such vegetation indices above such thresholds are effectively excluded from geological interpretation. Another approach to dealing with vegetation cover is to apply spectral unmixing techniques (e.g. MTMF), estimating the proportion of a pixel’s spectral signature that is affected by an assumed vegetation signature (Kruse et al., 1993). The resulting spectrally unmixed classification produces map products for each of the assumed vegetation, mineral, etc. components contributing to the reflectance signature from each pixel (Kruse et al., 1993). It assumes that the combined image pixel signature is a linear combination of the various surface components. This may not be the case when light is reflected and scattered between the various ground components. Also, it is not certain at what % of vegetation cover spectral unmixing will produce reliable mapping of the remaining geologically related components. The combined effects of shadows and non-linear spectral mixing should make the user cautious when interpreting geological components in forested areas or areas with dense shrub or grass cover. Armchair geological mapping via remote sensing in such areas, without follow up field work, is risky even with higher spectral and spatial sensor resolutions.
Case Studies
Satellite & Airborne
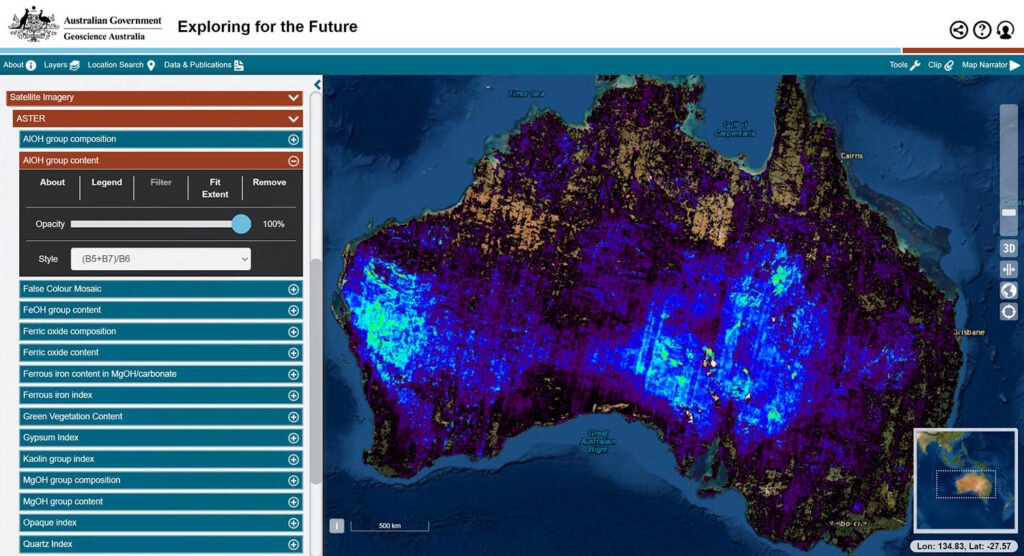
There have been many geological mapping case studies undertaken using ASTER since its launch in December 1999 (Abrams & Yamaguchi, 2019). Rowan and Mars (2003) showed early on that lithological mapping was feasible in areas of good exposure. Mosaicked multi-scene ASTER was also processed using simple devised spectral indices such as band ratios and RBDs to generate geological compositional maps within the Curnamona Province (Broken Hill) (Hewson et al., 2005). A successful attempt to generate 17 cross continental ASTER geoscience products (Cudahy, 2012; Caccetta et al., 2012) was later achieved and made available via Geoscience Australia [http://portal.auscope.org/index.htm; https://portal.ga.gov.au/persona/eftf].These large-scale Australian ASTER map products at 30 m spatial resolution have been successfully used for detailed exploration in arid to semi-arid areas such as in the Northern Territory’s Arunta Province Chubko gold prospect (Laukamp et al., 2013). A large scale interpretation of Australia’s weathered soils, deposition and regolith also utilises these cross continental ASTER map products (Cudahy et al., 2016). However, there can be limitations for the geoscience application of such map products in more temperate and cultivated regions (Hewson et al., 2015). Geoscience Australia (GA) has recently commenced generating regional surface compositional maps using Landsat and Sentinel-2, extracting the optimal seasonal acquisitions with the “barest” exposures of the geology (Roberts et al, 2019) [https://www.ga.gov.au/eftf/minerals/innovation]. Such satellite systems have a continuous multi-temporal operation, unavailable within the ASTER archive, although lacking ASTER’s multi-band SWIR capability. Even though ASTER has a only partial night-time acquisition capability, limited case studies have suggested that there is potential for observations of surface and subsurface thermal and physical properties (Hewson et al., 2017, Hewson et al., 2020). Interpretation of such night time imagery, ideally in conjunction with proximate day time thermal acquisition, offers the potential to derive thermal inertia properties related to porosity/density (e.g. outcrop vs transported cover) and moisture content (soil, sub-surface aquifer or green vegetation related) (Hewson et al., 2017). Currently NASA’s ECOSTRESS spaceborne thermal sensor project is studying such frontier research areas for environmental and geoscience applications [https://ecostress.jpl.nasa.gov/].
As mentioned above, there has been a growth in the use of commercial airborne hyperspectral sensors with higher spectral/spatial resolution than available from satellites, particularly within the VNIR SWIR wavelength region. In the late 1990’s HyVista’s HyMap (Cocks et al., 1998) demonstrated at the Pilbara Panorama site its ability to not only map high temperature alteration minerals such as topaz, but also map the distribution of muscovite’s chemical variation corresponding to the hydrothermal discharge / recharge sites within the overturned oceanic crustal exposed outcrops (Cudahy, 2016). Larger scale multi-flight line acquisitions of HyMap have been subsequently acquired and mosaicked into 1:100,000 scale map sheet sized areas within the Kalgoorlie, Broken Hill and Mt Isa mineralised province areas of Australia (Cudahy, 2016). HyMap currently acquires VNIR-SWIR imagery down to 1.8 m spatial resolution at a SNR of 500:1, and with orthophoto and DEM generating capability (Cocks, pers. comm). An example of combined hyperspectral airborne, outcrop sample and drillcore VNIR-SWIR spectroscopy from the Pedra Branca orogenic gold prospect, Brazil, demonstrates the potential for 3D exploration from remote sensing studies (Naleto et al., 2019). In particular, detailed field and drillcore sample spectral measurements identified a useful vector for locating mineralized veins by the presence of Al poor white micas (e.g. phengite muscovite) which weather to well-ordered crystalline forms of kaolinite within surface outcrops (Naleto et al., 2019). The recognition of this well-ordered kaolinite mineral vector, was useful for the interpretation of the hyperspectral ProSpecTIR VNIR-SWIR imagery because of its characteristic SWIR absorption feature with a 2.16 um and 2.20 um doublet absorption feature (Figure 3) (Naletoet al., 2019).


A demonstration of the capabilities of integrated VNIR-SWIR and TIR hyperspectral imagery to map iron oxide, clay, carbonate and silicate minerals has been successfully achieved with spectral unmixing (MTMF) techniques (Kruse, 2015). Although these image datasets were acquired for research studies by JPL/NASA with their airborne AVIRIS VNIR-SWIR (@3.2m) and HyTES TIR (@4.3m) sensors (Kruse, 2015), there is growing commercial activity in undertaking such joint multi-wavelength region hyperspectral surveying (e.g. SpecTIR, ITRES, HyVista). Such combined high spectral and spatial resolution VNIR-SWIR-TIR acquisitions are not feasible with current satellite sensors nor will be in the foreseeable future.
Marrying Geophysics and Remote Sensing?
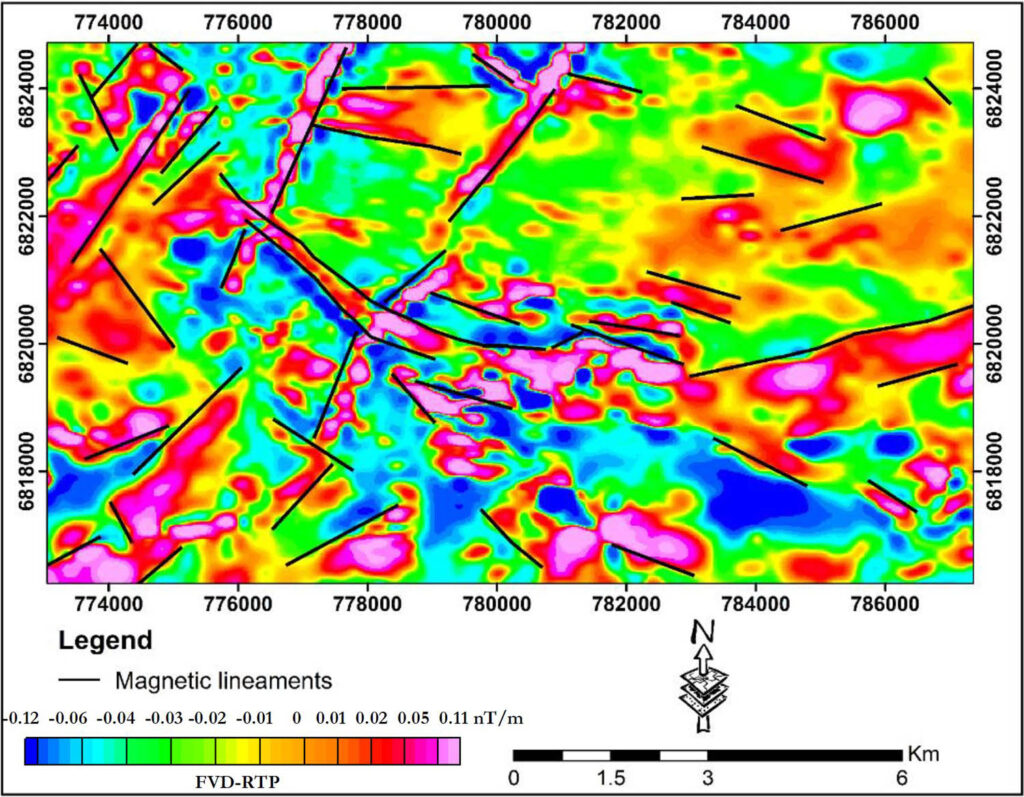
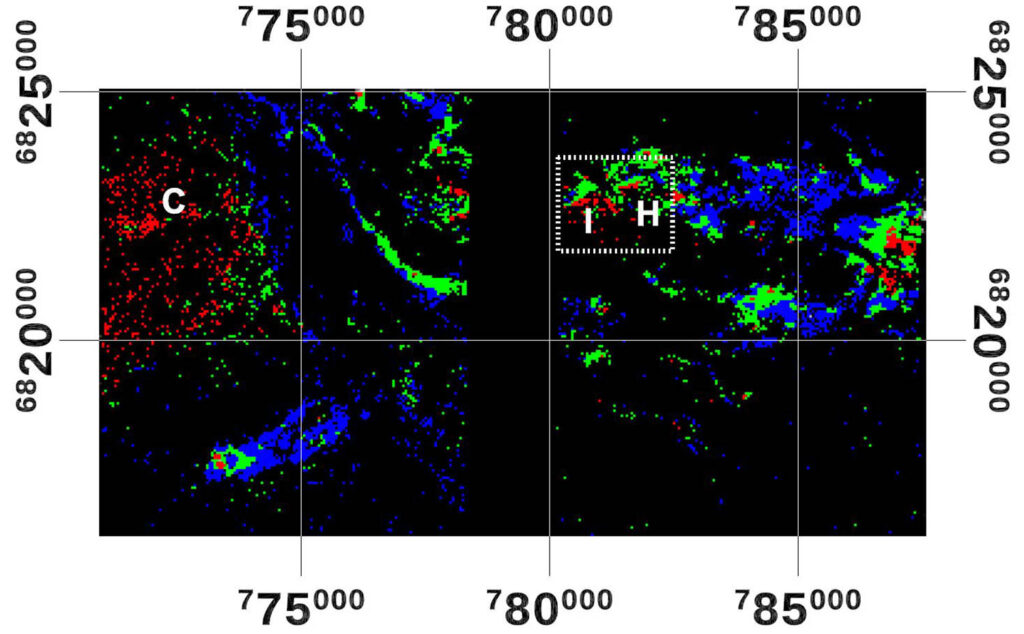
Integrating and utilizing both spectral and regional geophysical datasets has also proved useful where both are available. An example in the early days of ASTER using HYMap, DEMs and and regional geophysics at the Pilbara’s Woodie Woodie Mn prospect showed that there could be less ambiguity in the mineral interpretation of the individual datasets if all relevant information is combined (Hewson et al., 2006). For example, ferric iron oxides mapped by HyMap associated with Tertiary ferricrete, could be discriminated from hematite bearing altered units of interest by observing regolith units containing radiometric Thorium (Hewson et al., 2006). Also, manganese bearing dolomite units exhibiting silicification alteration were more clearly mapped using a combination of HyMap’s carbonate and ASTER TIR silica map products (Hewson et al., 2006). Overall, the study showed the combined use of both airborne and satellite spectral data was able to provide a cheaper way to narrow the target of geological units for helicopter borne EM surveys exploring for sub-surface manganese deposits (Hewson et al., 2006). Another case study demonstrating the benefits of utilizing both VNIR-SWIR remote sensing and regional airborne magnetics and radiometrics is shown for the Haib Cu porphyry deposit in Namibia (Hewson et al., 2019). Airborne HyMap imagery has been previously used by Teck Cominco Namibia Ltd. to identify argillic and sericitic units of interest for possible porphyry systems (Teck Cominco Namibia Ltd., 2009). Subsequent comparisons with ASTER and WV-3 SWIR imagery produced similar results (Hewson et al., 2019). Extracting lineament features from 1st Vertical Derivatives filtered airborne magnetics generated structural related shear zone and fault-line features that also corresponded well with several surface AlOH clay anomalous occurrences (Figure 5a & b). Also integrating the radiometric K data (Figure 5c) with the WV-3 AlOH clay index map product, using a scatterplot (Figure 5d) helped to refine the interpretation of the AlOH clay mineral map (Figure 5e). Although satellite WV-3 is used here with moderate spectral SWIR resolution, it appears to discriminate potassium bearing alunite alteration within the Haib Cu prospect (red areas: “H” and “I” within the white box, Figure 5e). Further field sampling is required, as other K anomalous areas are present (“C”, Figure 5e) and possibly related to K-feldspar bearing intrusives (Hewson et al., 2019).
UAV and Face Mapping
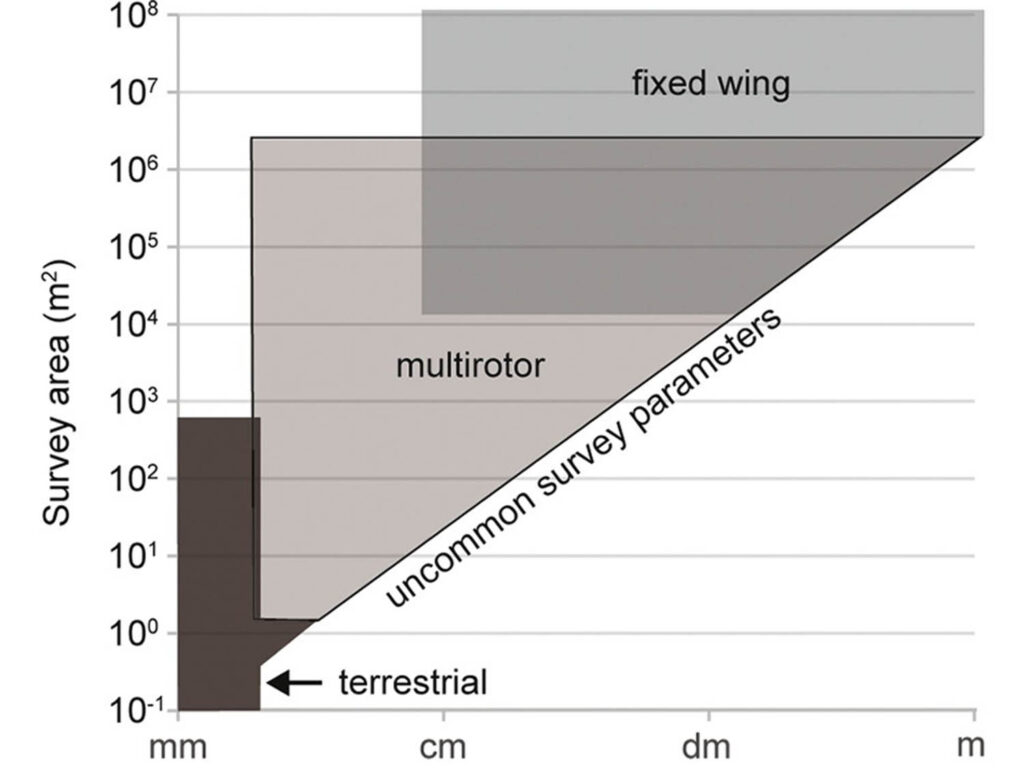
The development and deployment of UAV’s carrying VNIR-SWIR sensors for civilian geological applications has accelerated since 2010. As mentioned above, a number of constraints are still being overcome including payload capacity and flight duration. Several reviews have been published in various journals summarizing these developments (Dering, et al., 2019; Shahmoradi et al., 2020; Lee & Choi, 2016). In particular Lee and Choi (2016) describe their application for the mine site environment, accurately undertaking high spatial resolution topographic and visible wavelengths observations of opencut operations and stockpiles. Dering et al. demonstrates their usefulness in detailed outcrop observations of various dyke outcrops from several sites including a dyke swarm within felsic migmatite/granodiorite in south eastern Western Australia. In particular Dering et al. (2019) describes the visible orthoimage acquisition at 1 cm image and 2 cm DEM resolution as means to interpret the fracture density, dyke geometry/structure and chilled margins along a 500 x 20 m coastal outcrop. Four flights were undertaken to acquire imagery over a total of one hour. Spatial accuracy was optimized with multiple ground control points measured with an accuracy of 4mm. Dering et al (2019) recommended that users first need to decide on the required ground sampling distance (GSD; or ground pixel size) in order to determine the appropriate UAV configuration. The GSD affects the flying height and choice of sensor. Derring et al. (2019) suggests multirotor UAVs are generally better for low attitude surveys to produce a higher resolution GSD and are also able to better handle windy conditions. Figure 6, modified from Derring et al. (2019) illustrates the interplay between the GSD resolution and the economics of survey area for deciding the choice of fixed wing versus multirotor UAVs for such photogrammetric surveys.
A comprehensive and recent review of drone applications in the mining industry is presented by Shahmoradi et al (2020) discussing drone and sensor types, different mine related applications and include a detailed reference list. Such applications include surface mines (e.g. 3D mapping, slope stability, safety issues, inventory / construction monitoring), underground mines (e.g. geotechnical, gas detection), and abandoned mine monitoring (e.g. subsidence, rehabilitation, acid drainage monitoring) Shahmoradi et al. (2020). Shahmoradi et al (2020)’s paper also describes drones and models used in surface mines from fixed-wing to multirotor types, varying from 20 to 50 minutes endurance carrying a 150g to 1000 g payloads. However, such models with limited payload capacity are more relevant for standard RGB digital photography and orthophoto imagery rather than multispectral remote sensing (Shahmoradi et al, 2020). Other commercial drones listed here for other mining / geology applications include fixed-wing, and variations of multirotors (e.g. quadcoptor, hexacoptor) with an endurance range from 17 to 120 minutes and payload capacity from 250 g to 5.5 kg. Not all specifications for listed drone suppliers are present, however, it appears the multicoptors can carry larger payloads (e.g. Precision-hawk’s Quadcoptor/Hexacoptor, Microdrone’s Quadcoptor, Trimble’s Hexacoptor) (Shahmoradi et al, 2020).
A well-presented detailed account of using a Rikola VNIR hyperspectral sensor (5 kg) on a Aibot X6 V2 Hexacoptor for mapping acid drainage issues in the Sokolov lignite open pits is written up by Jackisch et al. (2018). Acid drainage is characterized here by jarosite, hematite, goethite and schwertmannite minerals having spectral absorption features within the 504 – 900 nm (eg 0.504 – 0.9 um) VNIR range of the Rikola sensor (Jackisch et al., 2018). Multi-temporal observations were acquired to observe changes in the acid drainage at 3 to 5 cm spatial resolution. The ground validated UAV study showed that it was successful in mapping jarosite and goethite associated minerals with SAM processing but not able to derive predictor relationships directly for the actual acidic ph levels observed (Jackisch et al., 2018). One of the study’s outcomes was that there was a limitation using only VNIR hyperspectral bands to 900 nm for a full iron oxide mineral mapping capability.

An example of VNIR-SWIR hyperspectral UAV systems are the HySpex instruments of Norsk Electro Optikk, consisting of a 400-1000nm VNIR sensor (4.6 kg) and a 970-2500 nm SWIR sensor (5.7 kg) (Jiang et al., 2019). A larger UAV platform in the form of the Airbon XT91 powered suspended glider was used to carry these sensors over the arid terrain of the Karatagh gold-copper prospect of western China. The quality of the acquired imagery and reflectance signatures were for the discrimination and mapping of iron oxides (e.g. goethite, hematite, jarosite) associated alteration at 0.8 m spatial resolution, using SAM and traditional hyperspectral processing techniques (Jiang et al., 2019).
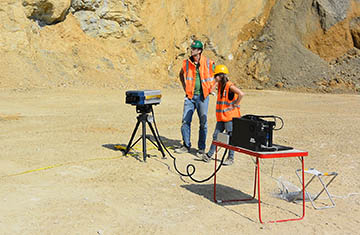
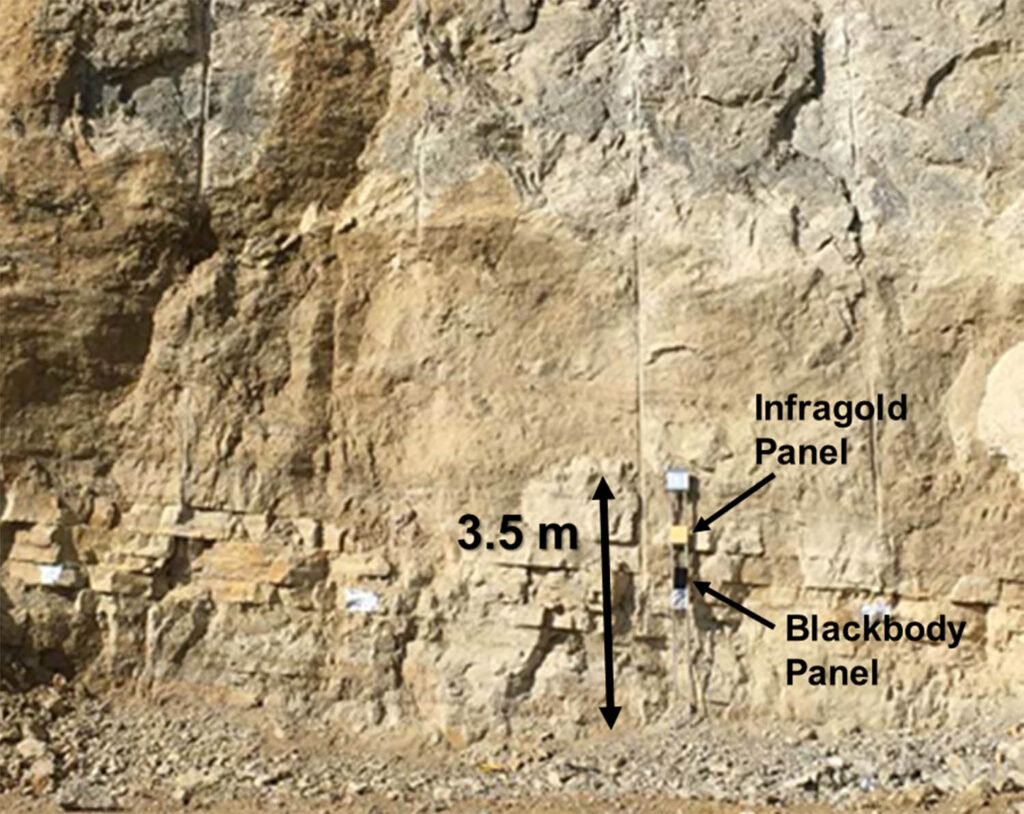
A variation of mine site UAV applications has been the recent deployment of ground based or proximal hyperspectral sensors targeting open cut walls or vertically exposed outcrops. There is naturally no issue regarding payload capacities or duration of acquisition operations. A TIR hyperspectral imaging sensor, Hyper-Cam, is available, including for hire by Telops Inc. [https://www.telops.com/], measuring thermal radiance from 7.7 to 11.8 um (4 cm-1 wavelength spectral resolution) within a focal plane detector array of 320 x 256 pixel imaging (Boubanga-tombet et al., 2018). A field study was undertaken at the Jura cement feedstock quarry, Cornaux, Switzerland, with the aim of testing its ability to assist quality control monitoring within the quarry. In particular, it is important for the cement plant operations to know how much dolomite and other silica or clay contaminants are present in the targeted calcite deposit (Boubanga-tombet et al., 2018). The Hyper-Cam sensor was placed at 35 meters from the quarry face and measured the thermal radiance signature with approximately a 26 cm2 pixel resolution (Figure 7). As mentioned previously, thermal radiance measurements involve more complicated pre-processing including the separation of the temperature component from the surface emissivity signature. However, with the aid of reference panels placed on the imaged quarry surface (Figure 8a) corrections of atmospheric and temperature effects were performed. Hyper-Cam’s TIR spectral resolution was sufficiently high to enable the spectral unmixing processing to discriminate and map the dolomite from the calcite by their main TIR absorption features, at 11.20 um and 11.32 um respectively (Figure 8b) (Boubanga-tombet et al., 2018).
Looking forward
The obvious benefits of using hyperspectral resolution VNIR-SWIR sensors has promoted an active interest by government space agencies to develop and launch such sensors on spaceborne platforms. The first civilian prototype of such a satellite-borne hyperspectral sensor was NASA/JPL’s Hyperion mission acquiring 30-meter resolution imagery for effectively 198 bands between 400 to 2500 nm, within a 8 km swath image (Pearlman et al., 2003). Recognisable VNIR-SWIR spectral signatures were generally acquired with the Hyperion sensor, however the SNR was poor (~40:1) within the SWIR wavelengths and precluded widespread mineral mapping applications (Cudahy, 2016). Several hyperspectral satellite sensors have been launched or are planned for deployment in the near future. A recently launched Italian mission, PRISMA, is currently undergoing initial validation studies and providing early imagery [http://prisma-i.it/index.php/en/]. Japan’s HiSUI hyperspectral 185 band 20-30 metre pixel VNIR-SWIR sensor is already installed on the International Space Station and data should be accessible after 2021 [https://ssl.jspacesystems.or.jp/en_project_hisui/]. Expectations are that HiSUI will have a favorable SNR of 450:1 for the VNIR and 300:1 for SWIR. The German Aerospace satellite sensor, EnMAP, is a planned 242 band 30 m spatial resolution VNIR-SWIR sensor with its own platform and planned for launch Q3 2021. EnMap also plans for a favorable SNR, 400:1 for the VNIR and 170:1 for the SWIR (https://www.enmap.org/). NASA’s “Surface Biology & Geology Mission” (formerly HyspIRI) are a possible pair of VNIR-SWIR hyperspectral and TIR 8 band sensors (https://sbg.jpl.nasa.gov/doc_links) is currently undergoing a feasibility review process. One major difference between the NASA and other hyperspectral missions above, is the possible planned larger swath image width of 150 km compared to the other mission 20-30 km swath widths. Such a wider image swath improves the potential capability to mosaic acquired scenes into larger regional, continental, or possibly global map products.
Summary
For geological remote sensing to have a reasonable chance of success it is critical that the practitioners have a clear understanding of their geological or mineralogical target(s) and likely surface exposure. The choice of the right sensor/platform/image product with the appropriate resolution should follow. Ground, environmental, illumination and atmospheric conditions need to be considered and accounted for during the acquisition and processing of the imagery. Integrating ancillary geoscience and/or regional geophysical data can often reduce ambiguities in the geological interpretation. A lot of geological remote sensing case studies have been published in journals and presented at conferences which can be a great asset for planning surveys, data acquisitions and extracting useful processing techniques. Finally, remote sensing is a rapidly changing technology and its advisable to stay abreast of new developments.
References
Abrams, M., & Yamaguchi, Y. (2019), Twenty years of ASTER contributions to lithologic mapping and mineral exploration, Remote Sensing, 11(11). 10.3390/rs11111394. 9
Boubanga-tombet, S., Huot, A., Vitins, I., Heuberger, S., Veuve, C., Eisele, A., Hewson, R., Guyot, E., Marcotte F. & Chamberland, M. (2018), “Thermal Infrared Hyperspectral Imaging for Mineralogy Mapping of a Mine Face” Remote sensing, 10, 10, 15 p., 1518.
Caccetta, M., Collings, S., Cudahy, T.J. A calibration method for continental scale mapping using ASTER imagery. Remote Sens. Environ. 2012, 139, 306–317.
Clark, R.N., King, T.V.V., Klejwa, M., and Swayze, G.A., (1990), “High spectral resolution reflectance spectroscopy of minerals.” Journal Geophysical Research, 95, B8, pp.12653-12680.pp.
Cocks, T., Jenssen, R.; Stewart, A., Wilson, I., Shields, T., (1998), “The HyMap airborne hyperspectral sensor: The system, calibration and performance. In Proceedings of the 1st EARSEL Workshop on Imaging Spectrometry, Zurich, Switzerland, 6–8 October, pp. 37–42.
Crowley, J.K., Brickley, D.W., and Rowan, L.C., (1989, “Airborne imaging spectrometer data of the Ruby Mountains, Montana: mineral discrimination using relative absorption band-depth images,” Remote Sensing of Environment, Vol. 29, pp121–134.
Cudahy, T.J. (2012), Australian ASTER Geoscience Product Notes; CSIRO Report, EP-30-07-12-44, Commonwealth Scientific and Industrial Research Organisation (CSIRO): Canberra, Australia, 2012. Available online: https://doi.org/10.4225/08/584d948f9bbd1
Cudahy, T. (2016), Mineral Mapping for Exploration: An Australian Journey of Evolving Spectral Sensing Technologies and Industry Collaboration, Geosciences, 6(4).10.3390/geosciences6040052. 2878.
Cudahy, T.C., Caccetta , M., Thomas, M., Hewson, R., Abrams, A., Kato, M., Kashimura, O., Ninomiya, Y., Yamaguchi, Y., Collings,S., Laukamp, C., Ong, C., Lau, I., Rodger, A., Chia, J., Warren, P., Woodcock, R., Fraser, R., Rankine, T., Vote, J., de Caritat, P., English, P., Meyer, D., Doescher, C., Fu, B., Shi, P., & Mitchell, R., (2016), “Satellite-derived mineral mapping and monitoring of weathering, deposition and erosion”, Nature Scientific Reports 6, Article number: 23702 , doi:10.1038/srep23702
Dering, G.M.; Micklethwaite, S., Thiele, S.T., Vollgger, S.A., Cruden, A.R., (2019), “Review of drones, photogrammetry and emerging sensor technology for the study of dykes: Best practises and future potential.” J. Volcanol. Geotherm. Res.
Duke, E.F. (1994), Near infrared spectra of muscovite, Tschermak substitution and metamorphic reaction progress: Implications for remote sensing. Geology, 22, pp 621–624.
Gomes, V.C.F., Queiroz, G.R., & Ferreira, K.R., (2020), “An Overview of Platforms for Big Earth Observation Data Management and Analysis”, Remote Sensing, Vol. 12(8), 25pp.
Grove, C.I., Hook, S.J., and Paylor II, E.D., (1992). “Laboratory reflectance spectra of 160 minerals, 0.4 to 2.5 micrometers”. JPL Publ. 92-2.
Hecker, C., Van Ruitenbeek, F. J. A., Van Der Werff, H. M. A., Bakker, W. H., Hewson, R. D. & Van Der Meer, F. D., (2019), “Spectral Absorption Feature Analysis for Finding Ore: A Tutorial on Using the Method in Geological Remote Sensing”, 1 Jun 2019, In: IEEE geoscience and remote sensing magazine. 7, 2, p. 51-71
Hewson, R.D., Cudahy, Mizuhiko, S., Ueda, K., and Mauger, A. J. (2005). ‘Seamless geological map generation using ASTER in the Broken Hill-Curnamona Province of Australia.’ Remote Sensing Environment, Vol. 99, pp. 159-172
Hewson, R.D., Cudahy, T.J., Drake-brockman, J., Meyers., J., and Hashemi, A., (2006). ‘Mapping geology associated with manganese mineralization using spectral sensing techniques at Woodie Woodie, East Pilbara.’ Exploration Geophysics, Vol. 37, pp. 389-400.
Hewson R., Robson, D., Mauger, A., Cudahy, T. Thomas, M. and Jones, S., (2015), “Using the Geoscience Australia-CSIRO ASTER maps and airborne geophysics to explore Australian geoscience”, J. Spatial Science, DOI: 10.1080/14498596.2015.979891
Hewson, R.D., Robson, D., Carlton, A. and Gilmore, P. (2017) Geological application of ASTER remote sensing within sparsely outcropping terrain, Central New South Wales, Australia. Cogent geoscience: open access, 31, article no. 1319259, 22 p., DOI 10.1080/23312041.2017.1319259
Hewson, R.D., Chinkaka, E., van der Meijde, M., Baugh, B., Titus, N. & Mubita, J.P., (2019), “Geological investigations with high spatial resolution WV-3 satellite imagery and regional geophysics at the Haib Cu porphyry, Namibia”, In Proc, 2nd Australasian Exploration Geoscience Conference, 2 – 5th Sept., 2019, Perth, Australia, 1-5pp.
Hewson, R.D., Mshiu, E., Hecker C., van der Werff, H., van Ruitenbeek F., Alkema, D., and van der Meer1 F., (2020), “The application of day and night time ASTER satellite imagery for geothermal and mineral mapping in East Africa”, Int. J. of App. Earth Obs. and Geoinform, Vol. 85, 1-13 pp.
Jackisch, R., Lorenz, S., Zimmermann, R., Möckel, R., Gloaguen, R. (2018), “Drone-Borne Hyperspectral Monitoring of Acid Mine Drainage: An Example from the Sokolov Lignite District. Remote Sens. 2018, Vol. 10, Page 385, 10, 385.
Jiang, G., Zhou, K., Wang, J., Cui, S., Zhou,S., & Tang, C., (2019), “Identification of iron-bearing minerals based on HySpex hyperspectral remote sensing data”, Journal of Applied Remote Sensing, Vol. 13(4), 16pp.
Kokaly, R.F., Clark, R.N., Swayze, G.A., Livo, K.E., Hoefen, T.M., Pearson, N.C., Wise, R.A., Benzel, W.M., Lowers, H.A., Driscoll, R.L., Klein, A.J., 2017. USGS Spectral Library Version 7: U.S. Geological Survey Data Series 1035, 61 p.
Kruse, FA; Lefkoff, A. B; Boardman, J. W.; Heiedbrecht, K. B. Shapiro, A. T., Barloon, P. J., Goetz, A. F. H., 1993, The Spectral Image Processing System (SIPS) – Interactive Visualization and Analysis of Imaging Spectrometer Data. REMOTE SENS. ENVIRON. 44:145-163.
Kruse, F.A., (2000), The effects of spatial resolution, spectral resolution, and signal-to-noise on geologic mapping using hyperspectral data, Northern Grapevine Mountains, Nevada, In Proc. 9th JPL Airborne Earth Science Workshop, JPL Publ. 00-18, pp.261-269.
Kruse, F. A. (2015). “Integrated visible and near infrared, shortwave infrared, and longwave infrared (VNIR-SWIR-LWIR), full-range hyperspectral data analysis for geologic mapping.” Journal of Applied Remote Sensing 9(1): 096005-1 to 096005-17.
Kruse, F. A., Baugh, W. M., & Perry, S. L., 2015, Validation of DigitalGlobe WorldView-3 Earth imaging satellite shortwave infrared bands for mineral mapping, Journal of Applied Remote Sensing, 9(1), 96044., https://doi.org/10.1117/1.JRS.9.096044
Laukamp, C., Cudahy, C., Caccetta, M., Thomas, M., Close, D., & Lennartz, R. (2013) Successful mineral exploration using multispectral remote sensing data – ASTER geoscience map of Australia, Proceedings 12th SGA Biennial Meeting, 12–15 August 2013, International Association for Mathematical Geosciences, Uppsala, Sweden, 4pp.
Lee, S. & Choi, Y., (2016), “Reviews of unmanned aerial vehicle (drone) technology trends and its applications in the mining industry”, Geosystem Eng., 19, pp197–204.
Mars, J. C., & Rowan, L. C. (2006). Regional mapping of phyllic-and argillic-altered rocks in the Zagros magmatic arc, Iran, using Advanced Spaceborne Thermal Emission and Reflection Radiometer (ASTER) data and logical operator algorithms. Geosphere, 2(3), 161-186.
van der Meer, F. D., H. M. A. van der Werff, F. J. A. van Ruitenbeek, C. A. Hecker, W. H. Bakker, M. F. Noomen, M. van der Meijde, E. J. M. Carranza, J. B. de Smeth, and T. Woldai (2012), Multi- and hyperspectral geologic remote sensing: A review, Int. J. Appl. Earth Obs. Geoinf., 14(1), 112-128, doi:http://dx.doi.org/10.1016/j.jag.2011.08.002.
van der Meer, van der Werff H. M. A, and van Ruitenbeek F. J. A., (2014) “Potential of ESA’s Sentinel-2 for geological applications,” Remote Sensing of Environment, vol. 148, pp. 124–133.
Myneni, R. B., F. G. Hall, P.J. Sellers, and A.L. Marshak (1995) ‘The interpretation of spectral vegetation indexes’, IEEE Transactions on Geoscience and Remote Sensing, vol. 33, 481-486.
Naleto, J.L.C., Perrotta, M.M., da Costac, F.G. & de Souza Filho, C. R. (2019), “Point and imaging spectroscopy investigations on the Pedra Branca orogenic gold deposit, Troia Massif, Northeast Brazil: Implications for mineral exploration in amphibolite metamorphic-grade terrains”, Ore Geology Reviews, Vol. 107, pp283-309.
Ninomiya, Y., Fu, B., Cudahy, T.J. Detecting lithology with Advanced Space-borne Thermal Emission and Reflectance Radiometer (ASTER) multispectral thermal infrared “radiance-at-sensor” data. Remote Sens. Environ. 2005, 99, 127–139.
Pearlman, J.S., Barry, P.S., Segal, C.C., Shepanski, J., Beiso, D. & Carman, S.L., 2003. Hyperion, a Space-Based Imaging Spectrometer. IEEE Transactions on Geoscience and Remote Sensing, 41(6), pp. 1160-1173.
Roberts, D., Wilford, J., and Ghattas, O. (2019), “Exposed soil and mineral map of the Australian continent revealing the land at its barest,” Nature Communications, 10, 11pp.
Rowan, L. C., and Mars, J. C., 2003, Lithologic mapping in the Mountain Pass, California area using Advanced Spaceborne Thermal Emission and Reflection Radiometer (ASTER) data. Remote Sensing of Environment, 84, 350–366.
Salisbury, J.W. and D’Aria, D.M., (1992). “Emissivity of terrestrial materials in the 8-14 mm atmospheric window.” Remote Sensing Environment, 42, pp.83-106.
Shahmoradi, J., Talebi E., Roghanchi, P. & Hassanalian, M., (2020), “A Comprehensive Review of Applications of Drone Technology in the Mining Industry”, Drones, Vol. 4, 34, pp25
Sherman, D.M. (1985). “The electronic structures of Fe3+ coordination sites in iron oxides: application to spectra, bonding and magnetism.” Physics and Chemistry of Minerals, 12, pp.161-175
Teck Cominco Namibia Ltd. , 2009, Renewal Report: Exclusive Prospecting Licence 3140. Retrieved from https://www.deepsouthresources.com/wp-content/uploads/Haib_NI43-101_May-3-2016_FINAL.pdf
