
By Dave Walsh1 and Ken Williams2
1Vista Clara Inc., Mukilteo Washington, USA.
2Lawrence Berkeley National Laboratory, Berkeley California, USA.
Introduction
The East River Experimental Watershed near Crested Butte Colorado supports the collective research activities of multiple US Department of Energy funded investigators seeking to understand the drivers and controls of mountain hydrology. Measurements in the watershed began in 2014 with an early focus on snowpack driven hydrologic processes including: groundwater dynamics, aquifer processes, and changes in soil moisture content and its role in driving microbial processes [1]. The US Department of Energy benefits from the added value of the science that is being performed in this watershed.
This article describes NMR geophysical measurements performed in three specific locations in this study area. The upper East River valley is a representative mountainous headwater where a combination of surface, borehole, and airborne geophysical measurements are being used to quantify hydrologic properties and processes including lithologic controls on groundwater storage. Both surface and borehole NMR measurements have identified a previously unrecognized, unconsolidated alluvial aquifer underlying much of the valley. In the absence of such measurements this aquifer would have remained unknown and uncharacterized.
Bradley Creek is a small first order stream that drains the upper East River valley. Measurements along the hillslopes adjoining Bradley Creek have focused on linking changes in soil temperature and soil moisture to microbial processes impacting organic carbon mineralization. A combination of soil sensors monitoring spatial and temporal variations in depth resolved soil moisture content were supplemented by a hillslope transect of shallow (approximately 1 to 1.5m depth) boreholes in which NMR measurements were collected at multiple timepoints over two consecutive summer growing seasons.
Redwell Basin is a high alpine catchment northwest of the city of Crested Butte, and groundwater discharge from this basin feeds tributaries to the Slate River. The Redwell Basin contains abandoned mines, and groundwater discharge from past mining activities is suspected of contributing to high acidity and high concentrations of dissolved minerals in Redwell creek and the Slate River [2]. Recent geophysical and hydrological investigations in Redwell Basin have focused on improving the understanding of groundwater circulation including locating the prominent flowpaths for both artesian and runoff groundwater.
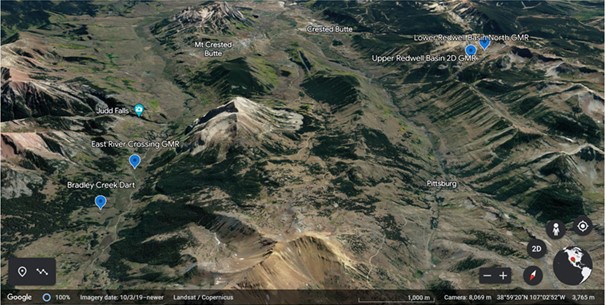
Figure 1: Map of NMR investigation sites in the vicinity of Crested Butte Colorado, USA.
This article presents the results of several field research and demonstration projects aimed at using newly available magnetic resonance geophysical technologies to improve the understanding of subsurface groundwater storage and discharge processes in different areas of the East River and Slate River watersheds. Particular and fundamental questions these NMR measurements sought to answer included: what is the aquifer geometry in the East river valley? How do hillslope sediments store and transmit groundwater in response to seasonal and short-term weather variations? How and where is groundwater stored and discharged in a high alpine basin?
NMR Geophysical Methods
Surface NMR is a non-invasive geophysical method that uses nuclear magnetic resonance to detect and image groundwater in the Earth’s magnetic field. The method involves laying out a relatively large detection loop of wire on the surface of the Earth. Loop diameters can range from 5m up to 150m depending on the desired depth of investigation. An electrical current pulse, or series of pulses, are applied to the detection loop at the resonant frequency of hydrogen in the local Earth’s magnetic field. These current pulses generate an alternating magnetic field in the subsurface, causing the net magnetic moment of hydrogen in water in the subsurface to precess (rotate) in phase with the applied alternating magnetic field. Following the transmit pulse(s), the magnetic moment of the liquid hydrogen in the subsurface continues to precess for a period of time, generating an alternating magnetic field, which is in turn detected as a small voltage on the detection loop [3].
The amplitude of the detected voltage is directly proportional to the volume of water that is excited by the transmitted pulse(s) in the sensitive region of the loop, and the time decay properties, T2* and T2, of the detected voltage signal are generally correlated with the pore sizes in which the water is held. By transmitting over a wide range of current amplitudes, the sensitive zone of the measurements is modulated over deep, medium and shallow portions of the subsurface volume beneath the detection loop. Forward modeling of the 3-dimensional field of the detection loop, and the NMR response to the various transmit current pulses in the loop, yields a set of linear equations which can be inverted to estimate the NMR signals emanating from different discrete depth layers in the subsurface. Finally, time-domain analysis yields a 1-D estimate of the total volumetric water content and the distribution of relaxation times as a function of depth [4].
Thus, surface NMR provides the following attractive capabilities for groundwater investigations:
• Direct, non-invasive detection of groundwater.
• Imaging of volumetric water content and relative groundwater mobility as a function of depth.
The surface NMR data in this article were collected using a GMR instrument (Vista Clara Inc.). The GMR instrument incorporates wideband, multi-channel detection circuitry enabling effective reference coil-based noise cancellation which is often a necessity depending on cultural noise; and a relatively short instrument dead time of 5 ms, which is required for detection of fast-decaying NMR signals from water in small pore spaces and in magnetic geology [5, 6].
Specific pulse sequences used in these studies include:
• Free induction decay (FID). This measurement consists of a fixed-duration and fixed-frequency current pulse at the Larmor frequency (the resonant frequency of groundwater in the local geomagnetic field). This pulse sequence generates a free induction decay signal with direct measurement of T2* relaxation, and is considered the “standard” pulse sequence. The FID sequence generally provides the largest depth of investigation of any pulse sequence, and also provides relatively high spatial (depth) resolution.

• Adiabatic pulse. This measurement consists of a single fixed duration current pulse that is frequency and amplitude modulated in a specific manner so as to generate large and coherent free induction decay signals over a wider interval of depths, compared to the standard FID pulse [7]. The adiabatic pulse produces an FID response with T2* relaxation. The advantage of the adiabatic pulse is that it can produce a significantly larger (i.e. 2x to 3x larger) NMR signal from the same subsurface water volume, compared to a standard FID pulse. The disadvantages of the adiabatic pulse are that it has relatively low spatial (depth) resolution, and often has a limited maximum depth of investigation compared to the standard FID pulse. Thus, adiabatic pulses most useful when basic detection of moveable groundwater in the near surface is a primary objective, and where the standard FID pulse does not produce high enough signal amplitudes to insure basic detection.
• Spin Echo or CPMG. The spin echo measurement consists of a fixed duration excitation pulse followed by a delay, and then a refocusing pulse with length 2x longer than the excitation pulse [8, 9]. The excitation pulse produces an FID signal, and the refocusing pulse produces a spin echo NMR signal. The CPMG sequence is a variant on the spin echo sequence wherein multiple refocusing pulses are applied in rapid sequence following the excitation pulse, resulting in multiple spin echo signals at different time delays in a single measurement. The sole major advantage of the spin echo and CPMG sequences is that they enable direct measurement of T2 relaxation, which is a much more reliable indicator of pore size when the subsurface geology has significant magnetic susceptibility and/or when there are significant gradients in the Earth’s magnetic field at the scale of the loop size. Thus, spin echo and CPMG pulse sequences are most useful for clearly and unambiguously identifying large pore water – via the measurement of long T2 relaxation, in cases where magnetic geology can cause shortening of the detected FID signal even though the water are contained in large pores.
The shallow borehole logging data in this article were collected using a Dart instrument (Figure 2, Vista Clara Inc.). The Dart instrument is a small form-factor, battery-powered single person portable NMR logging tool. The Dart equipment consists of a small toolbox-sized control unit, a short (~20-60m) cable, a 1.75 inch diameter NMR probe, and a laptop or tablet computer [10]. The Dart tool performs CPMG measurements at an echo spacing of 500us, which is sufficient for direct measurement of water content and T2 relaxation in both saturated and unsaturated soils. The sensitive zones of the Dart probe consists of two, thin cylinders that are concentric with the center of the tool, with diameters of approximately 5 inches and 6 inches, and a vertical length of approximately 6 inches as illustrated in Figure 2 (right).
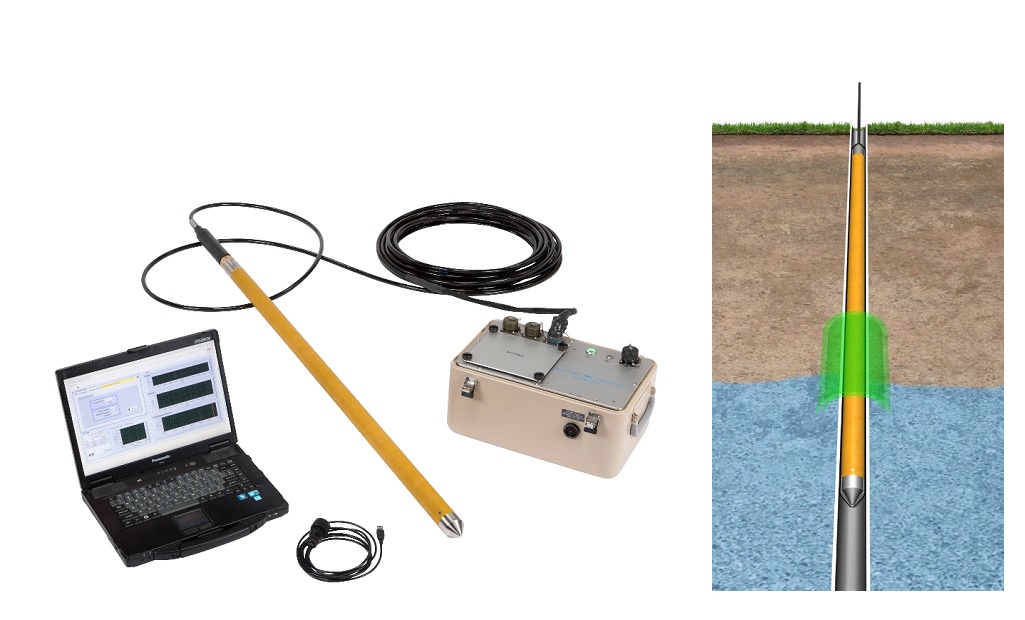
Figure 2: Left: Dart person-portable NMR logging tool. Right: rendering of Dart NMR tool inside a 2 inch PVC casing, with dual cylindrical measurement zones shown approximately to scale.
For this study, NMR measurements were performed in shallow boreholes with 2 inch PCV casing installed. These shallow monitoring wells were installed using manual auger tools to create a shallow 3 inch diameter borehole, and the 2 inch PVC casing were inserted into these boreholes to keep them in place for long term monitoring.
East River Groundwater Investigation
The goals of geophysical surveys in the upper East River valley were to map and characterize aquifers in this section of the valley. Figure 3 shows a photo of this section of the East River valley, with locations for the East River crossing surface NMR and borehole logging NMR, and the location of Bradley Creek and the shallow NMR soil moisture measurements.
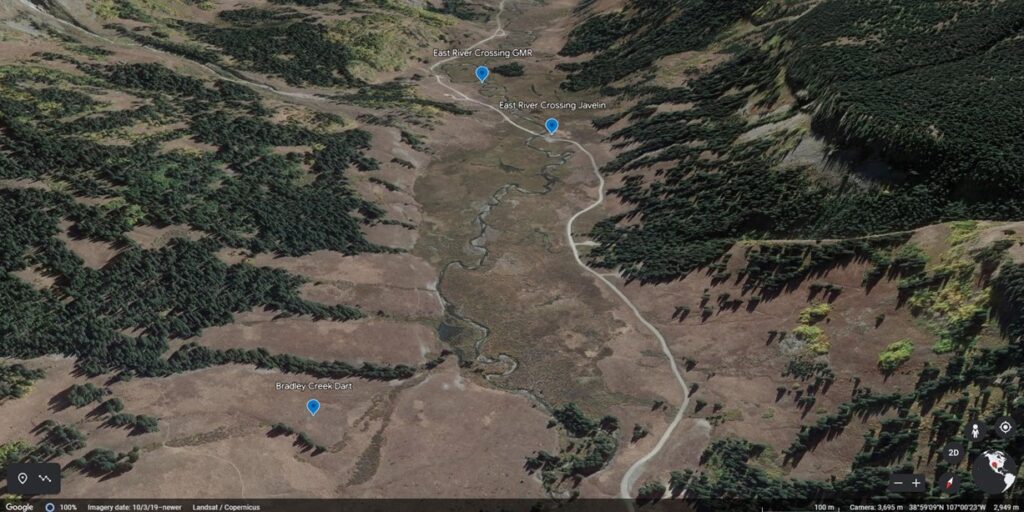
Figure 3: Overview of East River floodplain showing general locations for surface NMR and borehole NMR measurements near the East River Crossing and In-Situ Dart NMR measurements along the hillside near Bradley Creek.
Surface NMR measurements were performed at the East River crossing to map the geometry and hydrogeologic properties of the assumed shallow alluvial aquifer. An initial set of measurements were performed at a single location about 40m Northeast of the river, using a 40m diameter 2-turn circular detection loop. These initial measurements included an FID measurement, an adiabatic pulse measurement, and a CPMG measurement. The total measurement time for all three data sets was approximately 2 hours.
The surface NMR results clearly indicated the existence of two aquifers, which ran counter to the prevailing model of the valley as having a single shallow alluvial aquifer over low permeability bedrock. Figure 4 shows a composite image including the surface NMR inversion from the FID measurement at left, and the CPMG measurement at right. The FID inversion on the left indicates a high porosity unit at depths from 2m to 6m, and a second unit with higher T2* relaxation between depths of 13m and 22m. The inversion of the co-located CPMG measurement shows clear and strong spin echoes from water in both of these depth ranges (2-6m, and 13 – 22m), which confirms long T2 relaxation which can only occur in large water-saturated pore spaces consistent with saturated, permeable aquifer materials. Following the surface NMR survey, a 35m deep monitoring well was drilled and installed 400 meters upstream from the surface NMR survey location. This well was subsequently logged by the University of Wyoming using a Javelin NMR logging tool. The results shown in Figure 5 demonstrate that a 2-aquifer system also exists upstream from the surface NMR measurement, and the separation between the two aquifer units is less obvious at this location.
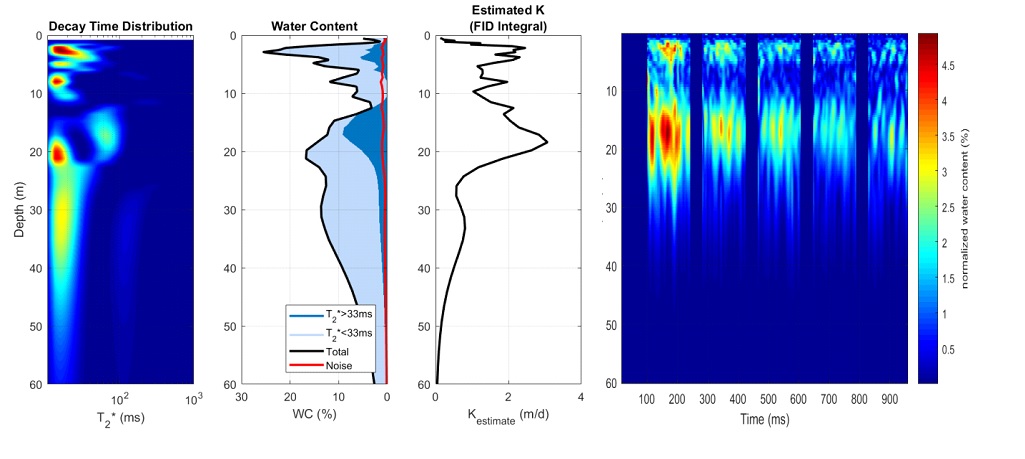
Figure 4: 1D surface NMR sounding at East River crossing. Significant water content with long T2 relaxation times detected at depths of 2-6m, and 13-20m. The lower aquifer (13-22m) was previously unknown to scientists studying the hydrogeology at this location.
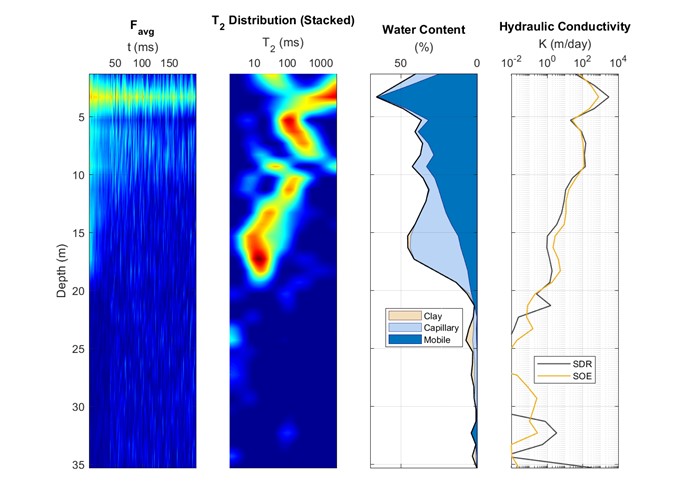
Figure 5: Javelin NMR borehole log of monitoring well GLS-1 at the East River crossing, approximately 400 meters upstream from the surface NMR measurement location of Figure 4. This NMR borehole log confirms the presence of two unconsolidated aquifer units, one with very high hydraulic conductivity in the upper 5 meters, and a second aquifer between 5m and 19m, with generally decreasing pore size and hydraulic conductivity in the lower parts of this aquifer.
This example demonstrated how a quick and inexpensive surface NMR measurement can unambiguously detect and image distinct aquifers, in this case resulting in a fundamental change in the understanding of groundwater storage and flow in this intensively studied watershed.
Bradley Creek Seasonal Soil Moisture Monitoring
The goals of NMR measurements along Bradley Creek were to quantify vertical and temporal changes in moisture content and changes in the mobile and immobile fractions of soil water. Dart NMR measurements were performed in four, shallow, hand-installed 2-inch PVC-cased wells, at various elevations adjacent to Bradley creek along the hill slope as shown in Figure 6 (left). The Dart equipment was carried in and out of the study by hand and backpack, using a hiking trail, as shown in Figure 6 (right). Measurements were performed on five separate days spanning a 15-month period between June 2016 and October 2017.
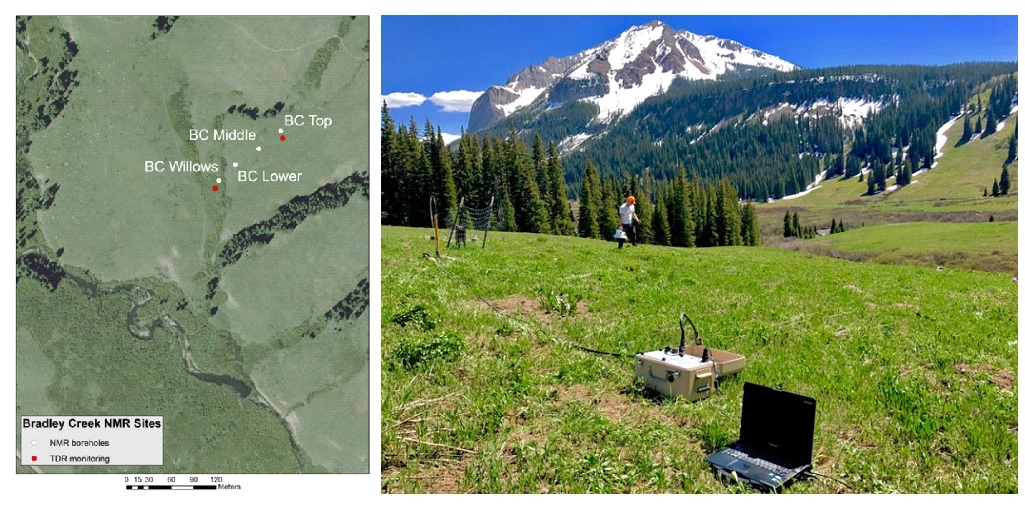
Figure 6: Left Overhead photo and map of Dart measurement locations along the Bradley Creek drainage. Right: photo of Dart tool at one of the Bradley Creek measurement locations.
The resulting NMR-measured water content logs are shown in Figure 7, for three of the measurement wells: BC Top, BC Middle and BC Willow. For each measurement in location and time, the total volumetric water content is quantified as a function of depth, and is segmented into estimated fractions of mobile, capillary-bound and clay-bound water. These time-lapse NMR logging measurements showed that near-surface soil water content responds differently to snowmelt and precipitation events at different locations on the hillslope. For example, on July 18, 2016, the NMR log at BC Top indicated the sediments were relatively dry, whereas at BC Middle and BC Willow the NMR logs showed high water content including mobile water in large, saturated pore spaces. Another temporo-spatial trend stands out when looking at the data set as a whole. The measurements at the highest elevation, BC Top, consistently show lower soil water content, and the measurements at the lowest elevation, BC Willow, consistently show the largest amounts of mobile water content, even in the relatively dry measurements in early October. This indicates that the lowest elevations are supported by base groundwater flow, while the highest measurements are not.
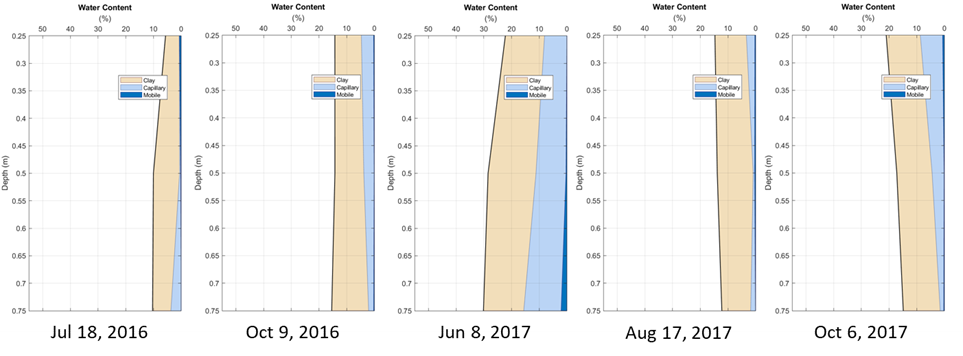
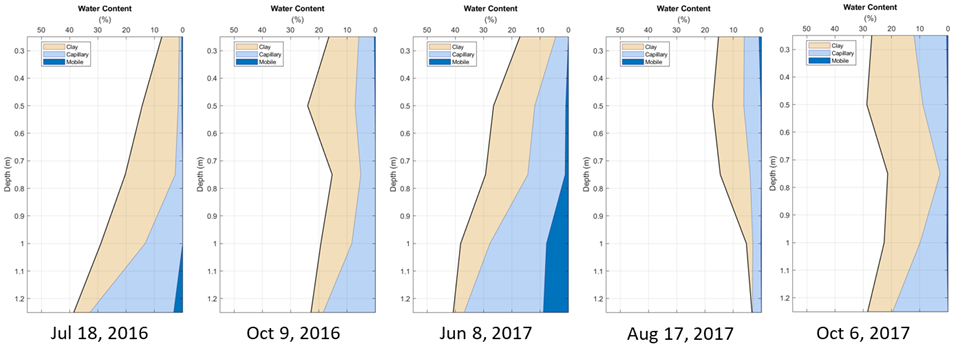
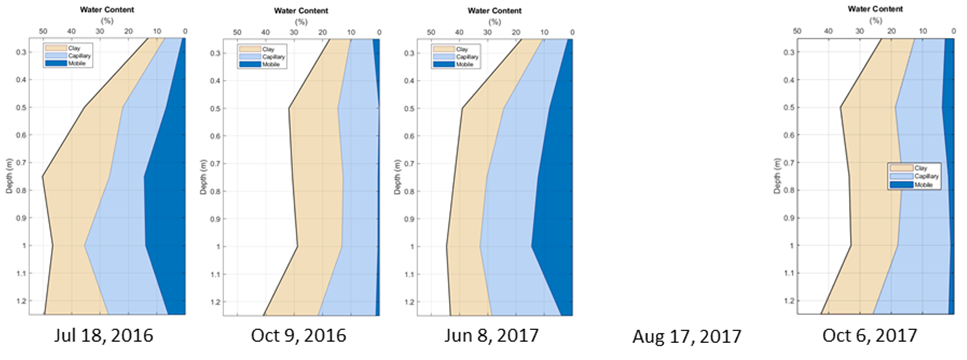
Figure 7: Dart NMR-measured water content vs. date at three locations along Bradley Creek drainage. Top row: BC Top, Middle Row: BC Middle, Bottom Row: BC Willow.
Redwell Basin Groundwater Flow Path Investigation
Extensive geophysical surveys and exploratory drilling have been conducted in the Redwell Basin study area since 2016. The goals of these various investigations have been to develop a better understanding of subsurface groundwater storage and movement in high alpine basins. This particular basin has multiple abandoned mineshafts and groundwater discharge features with complex groundwater chemistry. The objective of the USGS study [2] was to address multiple fundamental, yet poorly studied, aspects of groundwater flow and metals transport in mineralized mountain blocks, including: (a) the subsurface distribution of permeability and groundwater flow, and how this is controlled by geology; (b) water table dynamics and associated controls on mineral weathering; and (c) process-related details regarding sulfide oxidation and subsequent metal mobilization, transport, and ultimate emergence into the shallow environment via groundwater discharge. This work was intended to complement other studies in the Watershed SFA that focused more heavily on the adjacent unmineralized East River watershed.
Various geophysical measurements, including airborne and ground-based time-domain EM, were performed independently in attempts to gain better understanding of the groundwater discharge in this basin. These EM measurements indicated zones of very low electrical resistivity in the upper 30m of the subsurface in the center of the basin. But on its own this electrical resistivity information could not be unambiguously interpreted to assess the presence of groundwater and groundwater flow paths. Surface NMR measurements were performed in two areas of the basin as shown in Figure 8, prior to and after exploratory drilling in these areas.
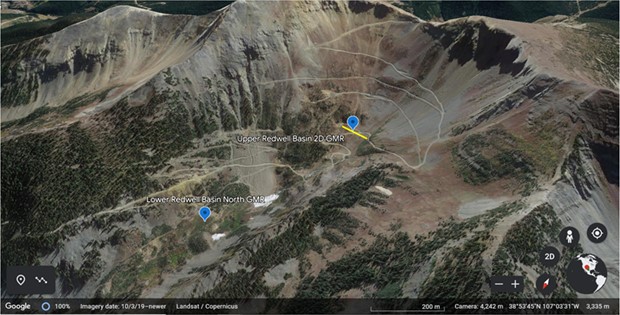
Figure 8: Overview of Redwell Basin study area, showing locations of 1D surface NMR measurements at Lower Redwell Basin, and 2D surface NMR measurement line at Upper Redwell Basin.
Surface NMR measurements were performed at the lower Redwell Basin using a 44m 2-turn circle. The total measurement time for the measurements was less than 2 hours. The results of surface NMR FID and CPMG measurements are shown in Figure 9 and include a co-located ground-based TEM measurement for comparison. The surface NMR data show significant mobile water content in large pore spaces in the top 13 meters. This is consistent with infill and weathered bedrock. The surface NMR data also indicate the presence of some mobile water content with low porosity and long T2 and T2* relaxation below around 26 meters. This is consistent with mobile water in fractured rock. The very low electrical resistivity in the zone between 13m and 35m is interesting but unexplained on its own, while the surface NMR indicate low mobile water content and low permeability in the zone from 13m to 26m.
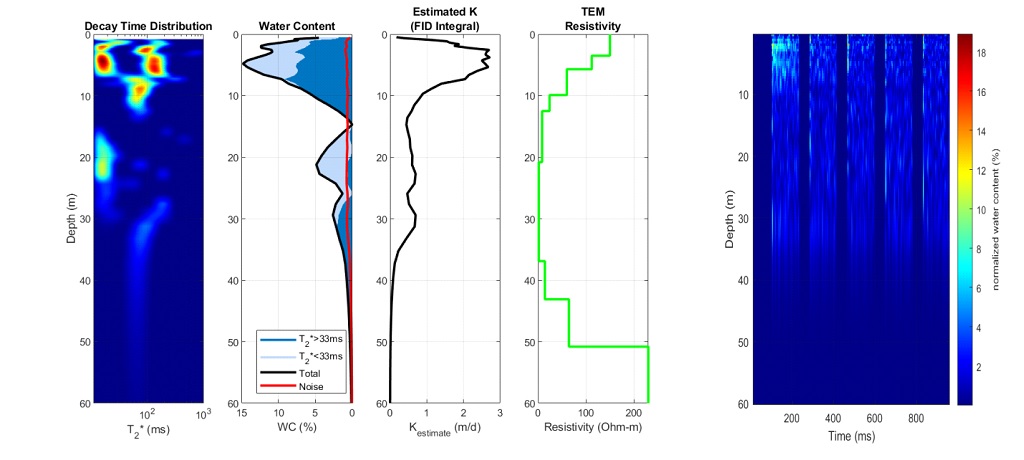
Figure 9: Lower Redwell Basin surface NMR soundings, using a 44m 2-turn circular loop. Left: FID surface NMR and time domain EM electrical resistivity soundings. Right: surface NMR CPMG sounding.
The objective of the surface NMR survey at the Upper Redwell Basin was to determine if there was mobile water flowing in the near subsurface beneath the extensive rockslide spanning the upper basin. A series of 19 surface NMR measurements were performed across a linear transect at the Upper Redwell Basin site, using a 9m 3-turn circular loop attached to a tarp for simplified movement over the relatively steep rockslide. The individual measurements were spaced 5 meters apart, and the line of measurements spanned most of the infilled portion of the basin. This set of 19 measurements was conducted in a single day.
For this survey we used an adiabatic pulse, which can generate a larger NRM signal than a standard FID pulse, and this advantage was especially useful for this survey where the anticipated groundwater volumes were small. A composite pseudo 2D image of the detected mobile water content is shown in Figure 10. This survey unambiguously identifies mobile water content at depths of 0.5 – 3m below the surface of the rockslide. The volumetric water content is relatively low, and the area with largest water content is in the center of the basin, with smaller amounts of detected water on the West side of the basin, and an absence of mobile water detected on the East side of the basin.
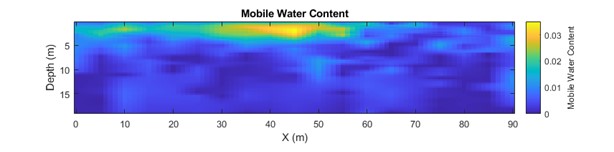
Figure 10: 2D surface NMR measurement of mobile water across the Upper Redwell drainage basin. October 2018.
Summary and Discussion
The NMR geophysical measurements in the East River Experimental Watershed provided unambiguous answers to fundamental mountain hydrology research questions, including the presence of important aquifers, groundwater flow paths and soil moisture. The NMR-measured soil moisture data enabled quantification of more bioavailable pools of soil water, e.g. clay bound, capillary and mobile water content and their variability over space and time. Surface and borehole NMR data provided insights into the presence of aquifers hosting considerable supplies of groundwater and groundwater flow processes at spatial scales (surface) and with high resolution (borehole) that could not have been achieved without such data.
Acknowledgements
This work is based upon work supported by the US Department of Energy under Award Numbers DE-SC0013293 and DE-SC0011387. The authors also wish to thank Burke Minsley, Andy Kass, Ben Bloss and Stephanie James of the US Geological Survey for their assistance in collecting all of the surface NMR data that were presented in this article, and Brad Carr of the University of Wyoming for collection of the Javelin NMR logging data presented in this article.
References
[1] Hubbard, S.S., Williams, K.H., Agarwal, D., Banfield, J., Beller, H., Bouskill, N., Brodie, E., Carroll, R., Dafflon, B., Dwivedi, D., Falco, N., Faybishenko, B., Maxwell, R., Nico, P., Steefel, C., Steltzer, H., Tokunaga, T., Tran, P.A., Wainwright, H. and Varadharajan, C. (2018), The East River, Colorado, Watershed: A Mountainous Community Testbed for Improving Predictive Understanding of Multiscale Hydrological–Biogeochemical Dynamics. Vadose Zone Journal, 17: 1-25.
[2] Manning, A., Ball, L., Wanty, R. and Williams, K. (2021), Direct Observation of the Depth of Active Groundwater Circulation in an Alpine Watershed. Water Resources Research, 57: 1-21.
[3] Legchenko, A., & Valla, P. (2002). A review of the basic principles for proton magnetic resonance sounding measurements. Journal of Applied Geophysics, 50(1–2), 3– 19.
[4] Walsh, D. O. (2008). Multi-channel surface NMR instrumentation and software for 1D/2D groundwater investigations. Journal of Applied Geophysics, 66(3–4), 140–150.
[5] Walsh, D. O., Grunewald, E., Turner, P., Hinnell, A., & Ferre, P. (2011). Practical limitations and applications of short dead time surface NMR. Near Surface Geophysics, 9(2), 103–113.
[6] Walsh, D. O., Grunewald, E. D., Turner, P., Hinnell, A., & Ferre, T. P. A. (2014). Surface NMR instrumentation and methods for detecting and characterizing water in the vadose zone. Near Surface Geophysics, 12(2), 271–284.
[7] Grunewald, E., Grombacher, D., & Walsh, D. (2016). Adiabatic pulses enhance surface nuclear magnetic resonance measurement and survey speed for groundwater investigations. Geophysics, 81(4), WB85–WB96.
[8] Grunewald, E., & Walsh, D. (2013). Multiecho scheme advances surface NMR for aquifer characterization. Geophysical Research Letters, 40(24), 6346–6350.
[9] Grunewald, E., Knight, R., & Walsh, D. (2014). Advancement and validation of surface nuclear magnetic resonance spin-echo measurements of T2. Geophysics, 79(2), EN15–EN23.
[10] Walsh, D. (2015). Environmental geophysics: Portable NMR tools for measuring and monitoring soil moisture. ASEG Preview, 2015(178), 41–42.
Authors’ Bios
Dave Walsh
Dave Walsh is the founder and President of Vista Clara Inc, where he has spent the past 20 years focusing on the development and commercialization of NMR geophysical instruments. His contributions to the field include the development of multi-channel surface NMR instrumentation and processing methods for groundwater investigations, development of small diameter low-cost borehole and direct-push NMR instruments for hydrological investigations, and the development of nuclear quadrupole resonance instruments for the detection of buried explosives. Dave earned his Ph.D. in Electrical Engineering from the University of Arizona, and B.S. and M.S. degrees in Electrical Engineering from Iowa State University.
Ken Williams
Dr. Kenneth H. Williams is a Senior Scientist and Program Lead for Environmental Remediation and Water Resources in the Climate and Ecosystem Sciences Division of the Lawrence Berkeley National Laboratory in Berkeley, California. He received a B.A. in Geology, an M.S. in Geophysics, and a Ph.D. in Environmental Science, Policy & Management from the University of California, Berkeley. He is the author or co-author of 220+ peer-reviewed publications. He is a pioneer in the field of biogeophysics, with a particular emphasis on the development of minimally invasive geophysical techniques for characterizing the subsurface activity of microbial communities and the products of their metabolism.
