
By Bruce Samuel 1 ,
1 RPS North America, 20405 Tomball Pkwy, Suite 200, Houston TX 77070
Abstract
After a decade of historic growth, wind power is now the most used renewable energy source in the US. Annual wind generation totaled 300 million (MWh) in 2019, exceeding hydroelectric generation by 26 million. The renewable energy sectors are surging and are predicted to be nearly 40% of the US energy market within the next three decades.
Currently, the US has only a single working offshore wind farm (Block Island), but a $70 billion market is forecast with the potential to generate 2000 GW per year and nearly double the nation’s current electrical use.
An explosion of offshore leasing for wind farms on the eastern seaboard has stretched the limits of US based offshore survey companies, requiring operators to reach across the Atlantic to Europe for vessels and in some cases, qualified personnel. Current proposed wind farm leases lie on the shallow Atlantic shelf in water depths between 30 and 60 meters, but floating offshore windfarms are already being proposed for deeper water.
The current subsurface survey approach utilizes tried and true 2D site investigation methods that were developed in the 1970’s. The purpose of this paper is to highlight potential new survey approaches and demonstrate how their application may increase efficiency, reduce uncertainty, and eliminate delays encountered during the development of a subsurface engineering ground model.
Introduction
A new market in offshore wind has arisen for the US offshore survey industry, which has traditionally serviced primarily oil and gas, telecommunications, and governmental clients. The Bureau of Ocean Energy Management (BOEM), which is the US regulatory arm for offshore leasing on the outer continental shelf (OCS), began leasing for offshore renewables in 2012 and today 19 offshore wind leases are presently active (BOEM 2020) in Rhode Island (4), Massachusetts (5), New York (2), New Jersey (2), Delaware (2), Maryland (1), Virginia (2), and North Carolina (1). The need for offshore survey work has progressively increased and this year, 2021, has again hit new highs.
Wind farm developers are required to submit a succession of progressively more intense plans (Site Assessment Plan (SAP), Construction and Operations Plan (COP) and General Activities Plan (GAP)) to BOEM for approval before installation of any renewable energy facility, structure, or cable. Site characterization surveys that evaluate the impact of seafloor and sub-seafloor conditions on the installation, operation, and structural integrity of the proposed project, are considered a key part of each of these plans (BOEM 2015).
In general, the required surveys include a number of progressive phases, where the preceding phase informs on the following phase, of high-resolution geophysical surveys (e.g. feasibility survey, site reconnaissance surveys, windfarm development area (WDA) surveys, internal-WDA cable route surveys, and transmission cable route (TCR) surveys) followed by a series of geotechnical investigations (e.g. reconnaissance geotechnical investigation (GI), WDA deep subsurface GI, internal-WDA cable route GI, and TCR GI).
The ultimate objective of this phased survey approach is a comprehensive site characterization that results from the integration of geophysical & geotechnical data. This approach involves the development of a subsurface engineering ground model (also known as a 3-D geologic model). The purpose of a ground model is to summarize subsurface lithology geophysically, develop unitized geotechnical soil parameters, and demonstrate how the parameters change across a specific area of interest (Figure 1). The model is a living project that grows as the geophysical surveys and targeted site investigations are performed. It allows for easy adjustment and updates to the seabed stratigraphic and structural layout and can be used to assist the evolution of a risk register.
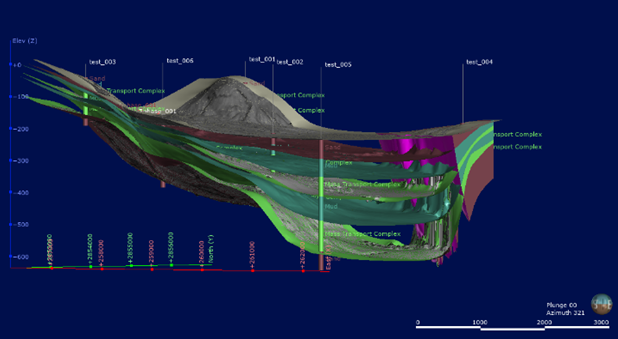
Figure 1. Subsurface view of a seismo-acoustic 3D Ground Model showing the varied soil zones and locations of proposed geotechnical borings and cone penetrometer tests (RPS 2020).
The modelling result is a 3-dimensional representation of the subsurface constructed from combined databases of all relevant input data (Figures 1 and 2). A ground model may take one of a number of different forms. For example, when based on bathymetric data in the marine environment, it may take the form of a terrain or geomorphological model; or when based on seabed reflection data, it may take the form of a structural model. It is typically created at the very early stages of a project and constantly evolves as additional data sets are integrated and the project develops. It is therefore a living and evolving product (SUT 2017).
Geographical Information Systems (GIS) offer several conveniences for the development, integration, and delivery of a ground model (Figure 2). Multiple data types from varied sources can be loaded into a GIS project, including variable scale maps and cross sections together with point source ground truth (geotechnical) data with associated attributes. GIS allows data to be correlated and visualized during the progression of integration, and specialized tools are available for detailed analysis and modeling. Since the GIS is a living and evolving product, the same project can be used to produce products at any step of ground model development, while retaining the database for later augmentation and refinement. GIS also allows speedy archiving and retrieval (SUT 2017).
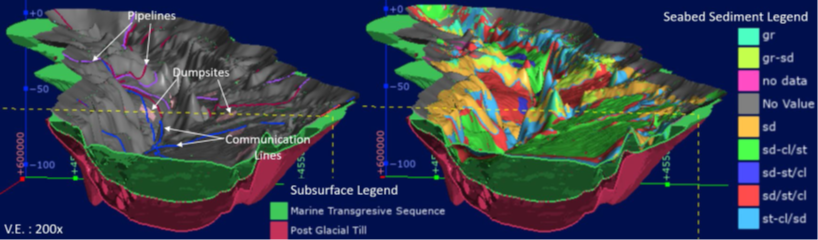
Figure 2. Cut away perspective view of 3D interactive GIS model showing perspective view of the seabed infrastructure and man-made hazards (Left) and seabed sediments from grab samples (Right). In the subsurface a fine-grained marine transgressive unit, deposited during the Holocene, overlies coarse post glacial till deposits (RPS 2020).
Current Methodology
In the US, the current approach for windfarm surveys is to collect 3 subsurface data sets:
Sub-Bottom Profiler (SBP): A sub-bottom profiler is high frequency (1.5 – 10 kHz) subsurface system designed for the acquisition of two-dimensional high-resolution images of shallow subsurface features (Figure 3). SBP’s, depending on soil conditions, altitude, sediment variability and other environmental factors, can usually provide 5 – 90 m of sub-seabed penetration and with resolution of subsurface layers 10 – 30 cm in thickness (Kearey et al., 2002). On the continental shelf, where coarser grained sediments tend to predominate, SBP penetration usually is limited to between 5 and 10 m of subsurface penetration.
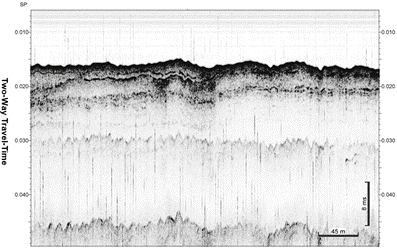
Figure 3. SBP record example from the shallow water shelf (Courtesy of Oceaneering International). Note lack of useable mapping horizons below ~8 ms (~6 m) below mudline.
Single Channel Seismic (SCS): Typically, a single channel seismic system is a lower frequency (100 Hz – 350 Hz) seismic profiling system designed for increased penetration to image deeper stratigraphy (Figure 4). This system, depending on soil conditions, can provide hundreds of meters of penetration and vertical layer resolution of less than 3 meters at the greatest depths (Tóth, 2011). Sound sources utilized for SCS are typically either boomers or sparkers, as the use of air guns is not allowed on BOEM renewable energy projects. A short mini streamer (3 -15 m), that houses an array of 8-15 summed hydrophones (summed into a single recorded signal), is towed behind the sound source.
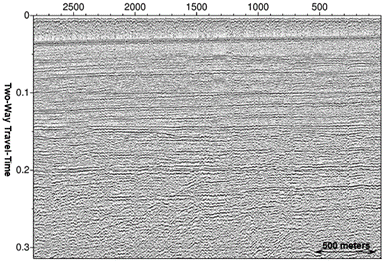
Figure 4. SCS record example from the shallow water shelf (Modified from Sliter et al., 2008)
Multichannel Seismic (MCS): In offshore wind, the multichannel seismic system generally utilizes the same system sound source components as the SCS. However, MCS systems use a longer streamer (hydrophone array) with 48 (or more) channels of recorded signals rather than a single. This allows for advanced post data processing to boost signal to noise ratio, remove signal artifacts, and migrate spurious offline returns (Tóth, 2011) which results in enhanced quality seismic profiles (Figure 5).
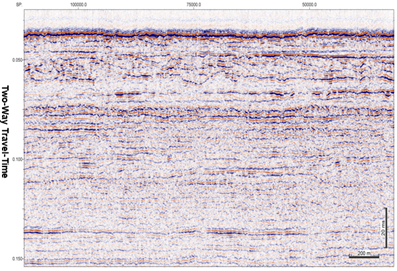
Figure 5. MCS example from the shallow water shelf (Courtesy of Oceaneering International).
The intent of the sub-bottom and seismic systems used for offshore wind projects is to complement one another by providing variable resolution and penetration to allow the best possible interpretable data for mapping the subsurface to different depths of interest.
The Problem: Limitations of the Current Approach
While the current approach is considered robust by the offshore wind industry, it has significant limitations in both spatial aerial coverage and resolution. The SBP provides excellent, sub-meter scale, bathymetric, seafloor texture and very shallow subsurface information. However, the sub-bottom profiler is still a 2D tool with a widely variable and limited penetration in the order of 5 –100 m. The SCS and higher-resolution MCS provide a nice profile (Figures 4 and 5), usually down to 1 second or more, but these data suffer from inadequate, inaccurate, and potentially dangerous migration processing errors, since any seafloor or subsurface features with cross-line (perpendicular or divergent) dip may be incorrectly located and imaged (Brookshire and Scott, 2015, Kearey et al., 2002, Robinson, 1983). In addition, both SCS and MCS also suffer from signal to noise issues (Robinson, 2000), especially in regions prone to high wave and wind conditions like those favored by offshore wind development, which can result in extremely poor vertical resolution (Figures 4 and 5). Moreover, and of largest importance, the typical line spacing for the deeper penetrating 2D SCS or MCS systems (150 m to 300 m) is so coarse that the features of interest (e.g., small scale (<50 m) rills or minor interglacial channels or other eroded depressions, common on the shelf, infilled by boulders or gravels) may not have been recorded, much less imaged (Figure 6).
The underlying problem with the current methodologies is continuity, both spatially and in resolution. Unfortunately, none of these tools, alone or in combination, provide a complete, continuous picture of the shallow subsurface. For example, consider the indisputable missing vital litho-stratigraphic information in areas without coverage in the 2D fence diagram geologic model from the Belgian Continental Shelf example presented in Figure 6. Having the complete picture is of paramount importance to the interpreter for accurately characterizing the subsurface and identification of hazards. However, with the current 2D methods utilized, the data falls far short of providing the entire picture.
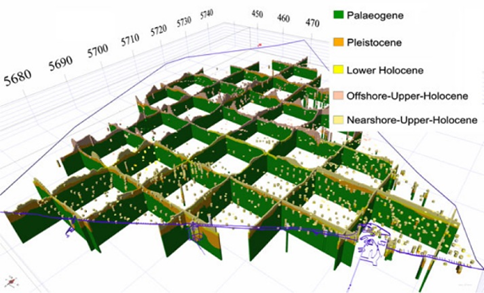
Figure 6. Fence diagram of voxelized lithostratigraphical units in the Belgian Continental Shelf. The borehole dataset is color-coded following their lithostratigraphical interpretation. The purple line represents the extent of the modelled area (Hademenos et al., 2019).
The Proposed Solution: Ultra High-Resolution 3D (UHR3D) Seismic
UHR3D is a tried and proven approach for high quality shallow penetrating seismic that provides the solution to the issue of continuity. Unlike 2D systems, UHR3D is able to capture the three-dimensional nature of both the seismic wavefield and the geologic features of interest, thereby enabling the accurate imaging of subsurface features in their true locations (Brookshire and Scott, 2015, Marfurt, 2006). In addition, the added signal of multiple additional hydrophones utilized in 3D acquisition, over that of 2D systems, serve to boost the signal to noise ratio enhancing vertical resolution. Furthermore, by its nature 3D seismic covers the entire area of interest eliminating holes and gaps and providing the full picture for interpretation, modeling, and design purposes.
A Brief History
The first published high-resolution 3D (HR3D) study was performed by Total in 1996 in the North Sea (des Vallieres et al., 1996) and this was followed by other projects by Shell, Vastar, and BP in the late 1990s and early 2000s in the Gulf of Mexico (Hill et al., 2015, Horkowitz et al., 2002).
In 2008, a higher intensity HR3D or Ultra High-Resolution 3D (UHR3D) system was introduced by a Norwegian start-up known as P-Cable 3D Seismic AS (Planke et al., 2009). Today, the P-Cable Seismic Streamer System remains the front runner in UHR3D. P-Cable is an exclusive joint venture between P-Cable 3D Seismic AS of Oslo, Norway and Geometrics, Inc. of San Jose, California (Ebuna et al., 2013).
In 2011 and 2012, Pacific Gas and Electric Company (PG&E), requisitioned a series of P-Cable surveys in the shallow water regions offshore of their Diablo Canyon nuclear power plant. The surveys were ordered in response to concern about the plant’s location relative to active faulting, post the Tohoku, Japan earthquake and tsunami (2011) that devastated the Fukushima Dai-ichi nuclear plant. The ultra-high-resolution P-Cable technology was necessary to effectively characterize offshore fault systems and delineate fault slip rates to ascertain the risk to the Diablo Canyon plant (Nishenko et al, 2012). This utilization of P-Cable study was deemed highly successful and serves as a prime example of the utility of the system in shallow water applications (Figures 7 and 8).
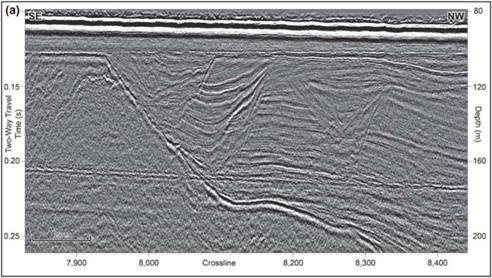
Figure 7. An example of P-Cable UHR3D data collected in ~80m of water and showing subsurface penetration of ~110m with very little loss of signal and superb resolution. Data courtesy of PG&E and NCS Subsea.
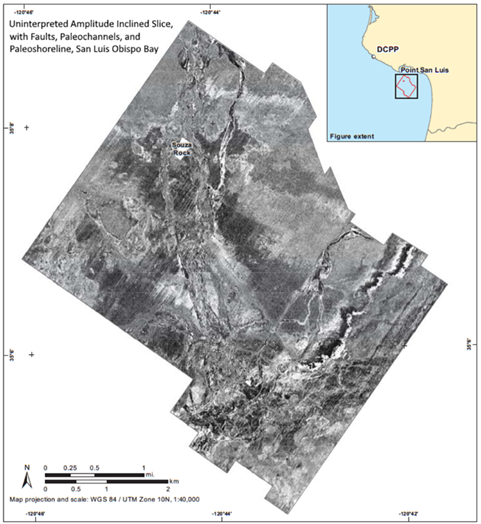
Figure 8. Amplitude time slice showing faults, paleochannels, and paleo-shoreline in San Luis Obispo Bay. This survey was conducted to delineate fault slip rates offshore nuclear power stations using the P-Cable system. Data courtesy of PG&E and NCS Subsea.
In 2013, a UHR3D survey was acquired by BP in the southern Norwegian North Sea in approximately 70 meters of water with the objective of depicting the upper 300 m below seabed. The outcome of this survey was exceptional, showing small-scale intra-glacial channels of 50 m width or less, with internal bedding imaged as well (Figure 9). The study was further able to define remnants of paleo-ice scour eroded into marine intra-glacial surfaces. A time-slice video of the top 500 m below seabed imaged a glacial history of alternating ice advance, retreat, and intra-glacial periods (Hill, et al., 2015).
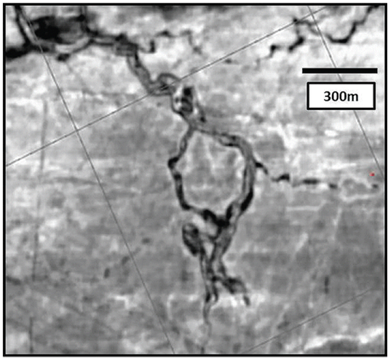
Figure 9. Norwegian North Sea UHR3D time slice at 120-ms TWT, 50 ms below seabed. The channel systems defined are less than 50 m across. Outside the channel systems, paleo-iceberg scours are defined on the intra-glacial paleo-seafloor (Hill, et al., 2015).
UHR3D Recent and Future Utility
Since 2013, UHR3D has continued to grow in popularity (Hill et al., 2015, Kassarie et al., 2017) and utilized in site investigation surveys in both shallow and deep water. BP, an early and now long-time user of this technology, has gone as far as to state that based on the demonstrated robustness and competitive cost, there is no reason not to acquire UHR3D for their geohazards program and beyond 2015, acquisition of HR2D will only be by exception at BP. A bold statement, but a true testament to BP’s belief in this new site investigation method.
In 2020 UHR 3D was acquired in the North Sea to define boulders in the subsurface. Recent projects along the eastern seaboard of the US have utilized UHR 3D for this same purpose.
Example UHR3D System for Shallow Water Acquisition
Figure 10 shows an example of a spread configuration (triple source, 20 streamers each 50 m in length, towed at a 6.25 m streamer separation) that has been specifically designed to image the upper 200 meters beneath seafloor in water depths as shallow as 25 meters. The system is designed to provide unprecedented clarity (1.5625m x 3.125m bin) and resolution (less than 30 cm vertical resolution), with an emphasis on near offsets in order to optimize imaging of the shallow subsurface. This configuration is also much wider than a traditional competitor’s 4 – 6 streamer 3D systems and will allow acquisition of 87.5-meter swaths on a single pass in shallow water, significantly decreasing operational time. The system is easily transportable, can be mobilized on a suitable vessel of opportunity, and run concurrently with other BOEM required high-resolution systems (Multibeam, Side Scan Sonar, SBP, and Gradiometer/Magnetometer) to provide single pass acquisition. Below is a single example that shows the P-Cable system is highly adaptable and multiple spread configurations can be designed to meet the client needs.
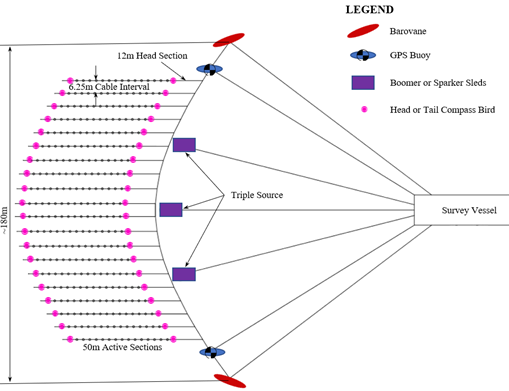
Figure 10. Schematic example of a wide swath P-Cable system for acquisition of UHR3D seismic for shallow water site investigations (Modified from basic schematic provided by NCS Subsea).
Discussion and Conclusions
As remarked upon earlier, the objective of this paper is to highlight UHR3D as a potential new survey approach and demonstrate how its application may increase efficiency, reduce uncertainty, eliminate delays, and reduce costs encountered during the development of a subsurface engineering ground model.
In the subsurface, the current methodology utilized calls for multiple surveys and several progressive phases starting with a widely spaced reconnaissance survey in the WDA that precedes a Pre-Construction Survey. The decision to perform a reconnaissance survey is usually a function of perceived ground complexity over a larger area in order to develop an initial seismo-acoustic model to inform general patterns of turbine siting (conceptual go – no go areas).
In Europe, where offshore wind got its start, the shallow subsurface is prone to the presence of shallow igneous or folded metamorphic bedrock and relic unexploded explosive ordnance’s (UXO) from World War II. The likelihood of the presence of such geohazards demand a reconnaissance survey as a necessity.
The United States (US) Atlantic shelf, where current wind farm development is taking place, is by comparison a passive margin that possesses thick wedges of overlying sediments within the shallow section (Miller et al., 2014). The shallow Atlantic continental shelf is also fairly pristine, in comparison to that of Europe, with locations of UXO’s and other infrastructure (pipelines, wells, cables) well known and well defined.
Since the bulk of the offshore developers in the US have roots in Europe, it is easy to see how the concept of a reconnaissance survey has been brought across to this margin unquestioned. The author of this paper is unaware of any situation faced by developers on the north Atlantic margin where no-go areas within leases have been identified by a reconnaissance survey. In light of these facts, the author questions the necessity for a separate reconnaissance survey on the US Atlantic continental margin.
The author suggests offshore wind developers consider a single geophysical survey (One and Done Concept-single geophysical mobilization requiring a single permit) utilizing UHR3D seismic system in conjunction with BOEM required high-resolution systems (Multibeam, Side Scan Sonar, SBP, and Gradiometer/Magnetometer) run concurrently. During the initial portion of the survey, the system would collect Phase I (swath coverage over lines of proposed wind turbine generator locations and subsurface coverage of multibeam (bathymetry), Side Scan Sonar, and UHR3D at the wide swath width (example 87.5m) and widely spaced SBP and Gradiometer/Magnetometer). Once the full area has been acquired, the UHR3D kit is demobilized, and the survey continues with Phase II (infill survey at the Archaeological (30m or 15m line spacing) BOEM requirement utilizing the required high-resolution geophysical suite).
The suggested process would be more efficient because it eliminates the need for multiple mobilizations and additional mobilization cost, and multiple permits. It will provide an initial Phase I high-resolution survey suitable for geohazards and site investigation planning purposes, comparable but far more resolute than a reconnaissance survey. If the most resolute data is collected first, it will front-end-load the development of a geophysical seismo-acoustic ground model that will not need to be progressively updated with additional geophysical data. This is in turn will speed up the planning process and allow more time for the model to mature and provide a more resolute end product for planning a geotechnical investigation.
Reducing Uncertainty, Cost, and Delays
The UHR 3D will provide data points throughout the entire survey swath along lines of planned wind turbine generator infrastructure, not at only 2D line locations. The very nature of 3D seismic data eliminates the migration issues that plague 2D seismic data. The processing phase of 3D seismic data is also far more robust and allows for the elimination of significantly more noise issues that are evident within 2D seismic. Cumulatively, these criteria will reduce uncertainty of the ground model.
In the geotechnical investigations that will follow, the use of UHR 3D will also allow a targeted approach to occur, where geotechnical borings and CPT can avoid potential subsurface geohazards and other surprises. This will lead to a reduction in uncertainty and more productive and targeted use of ground-truthing methods, which will in turn lead to additional cost savings and decrease in delays experienced during the project.
References
Brookshire, B., and Scott, L., (2015) Reducing Risk in Offshore Planning and Development, GEOExpro, April 2015 pages 72-74.
Bureau of Ocean Energy Management (BOEM) (2015), Guidelines for Providing Geophysical, Geotechnical, and Geohazard Information Pursuant to 30 CFR Part 585, 30 pages.
Bureau of Ocean Energy Management (BOEM) (2020), Atlantic OCS Renewable Energy – Massachusetts to South Carolina. Map ID ERB-2017-1004, Map Date 3/30/2020
des Vallieres, T., D. Enns, H. Kuhn, D. Parron, Y. Lafet, and D. Van Hulle, 1996, Mini-3D for shallow gas reconnaissance: Proceedings of the Offshore Technology Conference, Paper OTC-7986-MS, http://dx.doi.org/10.4043/7986-MS.Crossref|Google Scholar
Ebuna, D.R., Mitchell, T.J., Hogan, P.J., Nishenko, S., and Greene, H.G., (2013) High-Resolution Offshore 3D Seismic Geophysical Studies of Infrastructure Geohazards, SAGEEP 2013, Denver Colorado, USA
Hademenos, V., Stafleu, J., Missiaen, T., Kint, L., & Van Lancker, V. (2019). 3D subsurface characterisation of the Belgian Continental Shelf: A new voxel modelling approach. Netherlands Journal of Geosciences, 98, E1. doi:10.1017/njg.2018.18
Horkowitz, K., J. Thomson, and A. Hill, 2002, Characterizing turbidite depositional elements in the deep-water Gulf of Mexico with high-resolution AUV seabed imagery and high-resolution 3D seismic: Annual Convention and Exhibition, AAPG, Abstract, Search and Discovery article #90007©2002.Google Scholar
Andrew W. Hill, Adeyemi Arogunmati, Gareth A. Wood, Duncan Attoe, Mike Fiske, Alison Dingler, Jeff A. Dingler, Mark Hobson, Alistair Robertshaw, Craig Allinson, Einar Kjos, Mark Higson, Ted Manning, Kern Kassarie, and Stephen M. Lewis, (2015), “Slicing and dicing HR seismic acquisition: Varied approaches to delivery of high-resolution 3D seismic data volumes for drilling-hazard studies,” The Leading Edge 34: 380–382, 384–384, 386–388. https://doi.org/10.1190/tle34040380.1
Kassarie, K., Mitchell, S., Albertin, M., Hill, A., and Carney, B., 2017, Identifying and mitigating against potential seafloor and shallow drilling hazards at a complex Gulf of Mexico Deepwater site using HR3D seismic and AUV data, Near Surface Geophysics, EAGE, Vol. 15, Issue 4 415-426. https://doi.org/10.3997/1873-0604.2017026
Kearey, P., Brooks, M., and Hill, I., (2002), An Introduction to Geophysical Exploration, Third Edition, Blackwell Publishing Ltd, Oxford, UK, 262 pages.
Marfurt, K.J., (2006), Robust estimates of 3D reflector dip and azimuth, GEOPHYSICS (2006), 71(4):P29 http://dx.doi.org/10.1190/1.2213049
Miller, K.G., Browning, J.V., Mountain, G.S., Sheridan, R.E., Sugarman, P.J., Glenn, S., and Christensen, B.A., 2014, Chapter 3 History of continental slope sedimentation on the US middle Atlantic margin, Geological Society, London, Memoirs 2014, v.41; p21-34. Doi: 10.1144/M41.3
Nishenko, S., Hogan, P., and Kvitek, R., 2012, Seafloor Mapping for Earthquake, Tsunami Hazard Assessments. Sea Technology, 53(6), 15-20.
Planke, S., Eriksen, F.N., Berndt, C., Mienert, J., and Masson, D.G., 2009, P-Cable High-resolution 3D Seismic. Oceanography, 22, 81.
Robinson, E.A. & Treitel, S. (2000) Geophysical Signal Analysis, Society of Exploration Geophysicists, Tulsa, USA.
Robinson, E.A. (1983) Migration of Geophysical Data. IHRDC, Boston.
RPS Group (RPS) (2020), RPS Geophysical/Geotechnical Integration for Ground Model Development Qualifications Package – Background offshore wind experience and guidance for performing geophysical/geotechnical integration and modeling, RPS Internal Publication, 19 pages.
Society for Underwater Technology (SUT) (2017), Offshore Site Investigation and Geotechnics Committee – Guidance Notes for the Application of Geophysical and Geotechnical Techniques for Reducing Tophole Risks in the Drilling of Offshore Wells, 35 pages.
Sliter, Ray W., Triezenberg, Peter J., Hart, Patrick E., Draut, Amy E., Normark, William R., and Conrad, James E., 2008, High-Resolution Chirp and Mini-Sparker Seismic-Reflection Data From the Southern California Continental Shelf–Gaviota to Mugu Canyon: U.S. Geological Survey Open-File Report 2008-1246, U.S. Geological Survey, Menlo Park, CA.
Tóth T. (2011) Single and Multichannel Seismics. In: Gupta H.K. (eds) Encyclopedia of Solid Earth Geophysics. Encyclopedia of Earth Sciences Series. Springer, Dordrecht, Volume Part 5, 2011, Pages 1366-1373
The author thanks Oceaneering International, PG&E and NCS Subsea for providing the images shared in this paper
Author Bios

Bruce Samuel, MSc., P.G.
Bruce is a principal engineering geoscientist and project manager at RPS with over 20 years’ experience in the marine survey, offshore wind, oil & gas, and telecommunication industries as a Geohazards and Site Investigation Specialist. Bruce oversees projects for public and private stakeholders related to renewable energy, regulatory bodies, and oil and gas. He provides expertise on tasks related to desktop studies, cable burial risk assessment, survey planning and tendering, survey oversight, offshore client representation and geophysical data analysis. Bruce also provides geotechnical investigation planning, geophysical / geotechnical integration for the formulation of ground models, HAZID, formulation of risk registers and risk assessments including suitability analysis.
His recent relevant projects include ground model formulation for offshore wind projects; offshore geotechnical client representation for offshore wind projects (Ørsted, Equinor, Vineyard Wind); infrastructure favorability mapping and ground modeling for deepwater projects; integrated sequence stratigraphic assessments for well, pipeline, and cable route design (DTS); and BOEM suitability analysis studies for floating offshore wind. Throughout his career, Bruce has worked on numerous studies for the siting of wind turbine generators, cables, pipelines, and other infrastructure in both shallow and deep water.
