
By Abbas Mohamed Abbas1, Gad ElQady1, Hany Salah Mesbah1, Usama Massoud1, Ahmed M. Lethy1, Ahmed E. El Emam1, Mohamed A. Khalil2, Roger S. Vickers3, Kathleen Martinez4, and Zahi Hawass5
1National Research Institute of Astronomy and Geophysics (NRIAG), 11421 Helwan Cairo, Egypt
2University of Nebraska, Lincoln. 68588 Nebraska NE, Unites States.
3President, International Radar Consultants’ Santa Cruz, CA, USA.
4Catholic University of Santo Domingo, Director of Taposiris Magna project.
5Egyptologist Expert, Former minister of antiquities, Cairo, Egypt.
Abstract
This study was initiated in 2010 to search for Cleopatra’s Tomb at the Tap-Osiris Magna Temple, located in Borg El-Arab, Alexandria, Egypt. This study focuses on archaeological investigations using geophysical approaches. In this study, an integrated geophysical survey was conducted on two phases (PHASE-I and PHASE-II). Phase-I has been conducted by incorporating ground penetrating radar (GPR), electrical resistivity tomography (ERT), and magnetic gradiometry (MAG). The results obtained from PHASE-I could not confirm the existence of major tombs at this site. However, small possible cavities were strongly indicated which encouraged us to proceed and execute PHASE-2 to investigate this site by using another geophysical approach including very low frequency electromagnetic (VLF-EM) technique.
The VLF-EM data were going through qualitative interpretation by applying Fraser filtering process, while quantitative interpretation has been carried via 2-D VLF inversion of the data and forward modeling. Results obtained from VLF-EM interpretation are correlated with 2-D resistivity imaging and drilling information. Findings showed a highly resistive zone at a depth extended from about 25 to 45m buried beneath Osiris temple, which could be indicated as the tomb of Cleopatra and Anthony. The depth of archeological findings as indicated from the geophysical survey is correlated well with the depth expected by archeologists, as well as, the depth of discovered tombs outside Tap-Osiris Magna temple.
This study provided valuable insights on the geological and structural characteristics of the Tap-Osiris Magna site, providing guidance for future exploration efforts and for the possible discovery of Cleopatra’s Tomb.
Introduction
Integrated geophysical techniques have proven to be a viable approach in archaeological studies for the detection of hidden archaeological structures. In this study, we focused on an archaeological site located approximately 45 kilometers west of Alexandria. The site covers an area of approximately 88 meters by 90 meters and has undergone excavation and cleaning, resulting in a highly irregular and rough surface (Figure 1). This topographical complexity poses challenges for certain geophysical methods employed in this investigation.
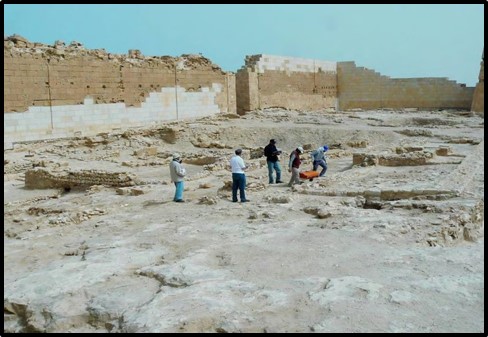
Figure 1: Tap-Osiris Temple site looking East showing the rough surface.
The objective of this study was to investigate and provide evidence either supporting or refuting the suggestion that the tomb of Cleopatra, and possibly Mark Anthony, is located beneath the Temples of Osiris and Isis within the Tap-Osiris Magna complex. According to the hypothesis, the tomb is situated at a depth ranging between 20 and 30 meters below the surface and can be accessed through a vertical shaft or inclined tunnel, potentially originating outside the complex. The local geological composition consists of limestone and sandstone, with the uppermost 10 meters exhibiting poor quality due to the presence of numerous small holes and inclusions, while the quality of the limestone is improved at greater depths, to the point where it could be used for tomb construction.
Methodology
To investigate the site, four geophysical methods were employed sequentially through two phases. The GPR, ERT and MAG methods were applied in Phase-I, while the VLF-EM method was applied in Phase-II following analysis of the GPR, ERT and MAG data sets.
- Ground Penetrating Radar (GPR): GPR was utilized to obtain subsurface information. It is a time-domain technique, giving direct information on echo depth, once the radar wave velocity has been determined. It was expected that GPR would provide valuable data beyond the 10-meter depth range, which turned out to be the case. Additionally, GPR has the capability to generate image-like representations of the topmost few meters of the site.
- Electrical Resistivity Tomography (ERT): ERT was employed to analyze subsurface electrical resistivity variations. Similar to GPR, ERT is capable of providing information at depths beyond 10 meters. It can also produce image-like outputs of the shallow subsurface layers.
- Magnetic Gradiometry (MAG): MAG was used to measure variations in the magnetic field. While MAG is primarily suited for detecting magnetic anomalies near the surface, it was included in the study to provide complementary data alongside with GPR and ERT.
- Very Low Frequency Electromagnetic (VLF-EM), VLF_EM was applied to investigate the deeper subsurface fractures, fissures, joints that may have conductive material or water and/or underlying tunnels or cavities beneath the ground surface.
Field Geophysical Survey
At the Tap-Osiris temple site, the field procedures began with implementation of the ERT profiling These profiles were important for determining the resistivity changes with depth over the study area, which would help us to determine the maximum effective depth of the GPR scan. The rock in the site exhibited a favorable resistivity of 200 Ohm*m, indicating good conditions for GPR investigations.
Once the necessary information was gathered from the ERT profiles, a comprehensive geophysical coverage plan was devised to achieve the study’s objectives. It was determined that conducting GPR surveys was feasible due to the suitable soil resistivity, which increased with depth, allowing for effective GPR data collection.
The GPR system utilized in the study was the SIR-3000 from Geophysical Survey Systems, Inc. (GSSI). Figure 2 illustrates the distribution of the GPR profiles conducted across the temple grounds. The GPR units were employed intensively over several days to extensively survey the area. Initial observations revealed that higher frequency GPR antennas (100, 200, and 400 MHz) performed poorly on the site and had limited penetration capabilities. However, the 40 MHz antenna proved successful, reaching depths of up to 30 meters before encountering noise limitations. Consequently, the 40 MHz antenna became the primary GPR device used for the remaining survey, covering all areas of interest within the site. A total of 149 GPR profiles were conducted, with the majority employing the multi-frequency 40 MHz antenna. The 100 MHz and 200 MHz antennas were selectively used in specific locations such as over the tunnel, around the well shaft, and against the southern wall of the well-shaft. All GPR measurements were performed in time-mode, with horizontal distances measured and incorporated into the GPR profiles through trace interpolation. The REFLEX 5.8 software (Sandmeier, 2001) was utilized for processing the collected GPR data. Figure 3 depicts the 40 MHz GPR antenna in use.
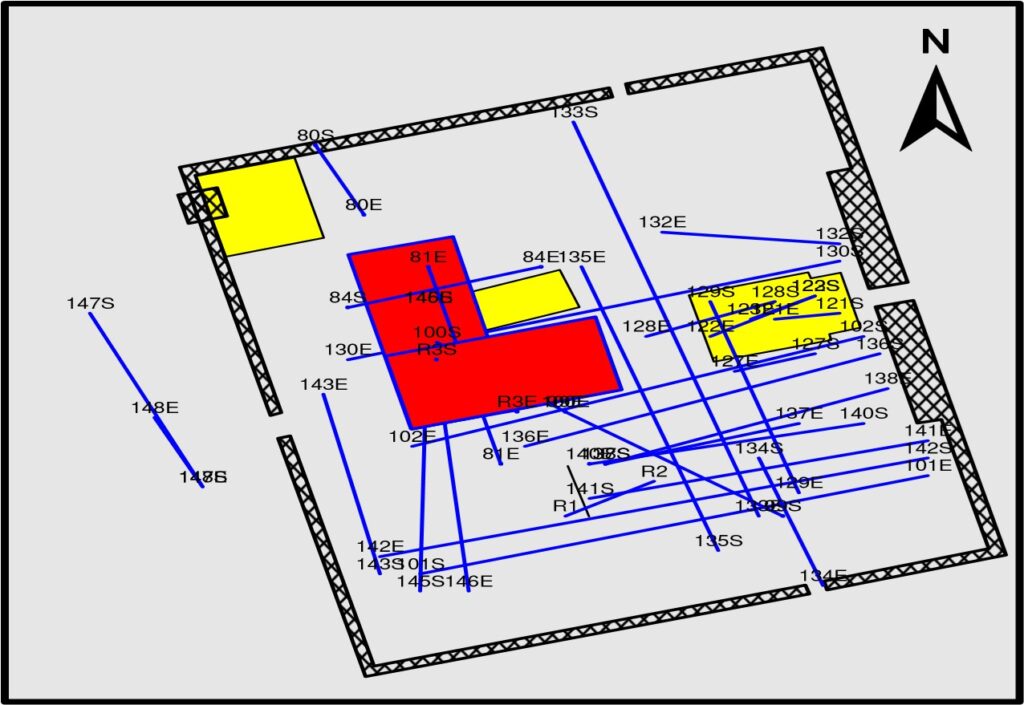
Figure 2: Distribution of the GPR profiles over the temple site.
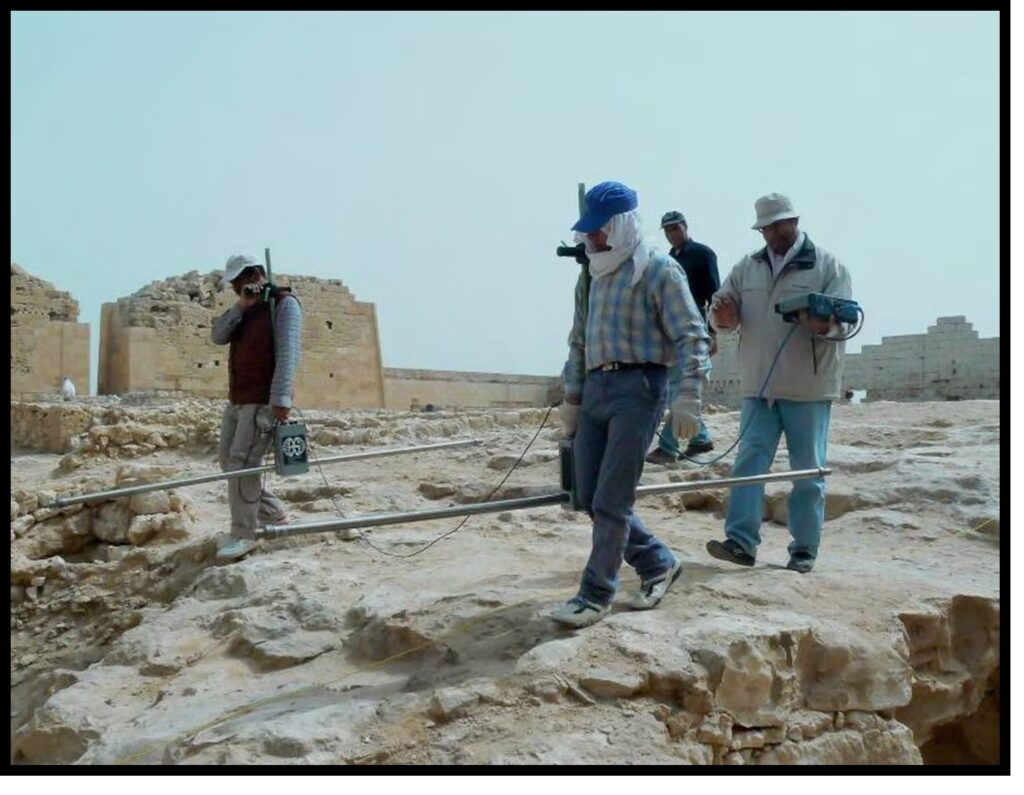
Figure 3: 40 MHz GPR Antenna in use.
The ERT data were measured along 20 profiles (Figure 4) trending in different directions and with variable lengths to ensure a full data coverage based on the site accessibility. The acquired ERT data were processed using the RES2D-INV software, which converted the data into 2-D cross sections. However, the software’s limited color palette resulted in hard boundaries between regions of increasing or decreasing resistivity, potentially creating a visual impression of subsurface structures that may not actually exist. To address this limitation, the SURFER program from Golden Software, Inc. was employed to display the ERT results. Despite these challenges, ERT remained an important technique, as it was less susceptible to the limitations that affect GPR performance. For the ERT measurements, the SYSCAL R2 system from IRIS Instruments was used. The system incorporated a multi-node setup to facilitate tomography by automatic switching between different electrode arrangements. The acquisition process had utilized the Wenner electrode configuration with equal distance between electrodes set at 2.5 or 3 m, depending on the maximum available horizontal distance.
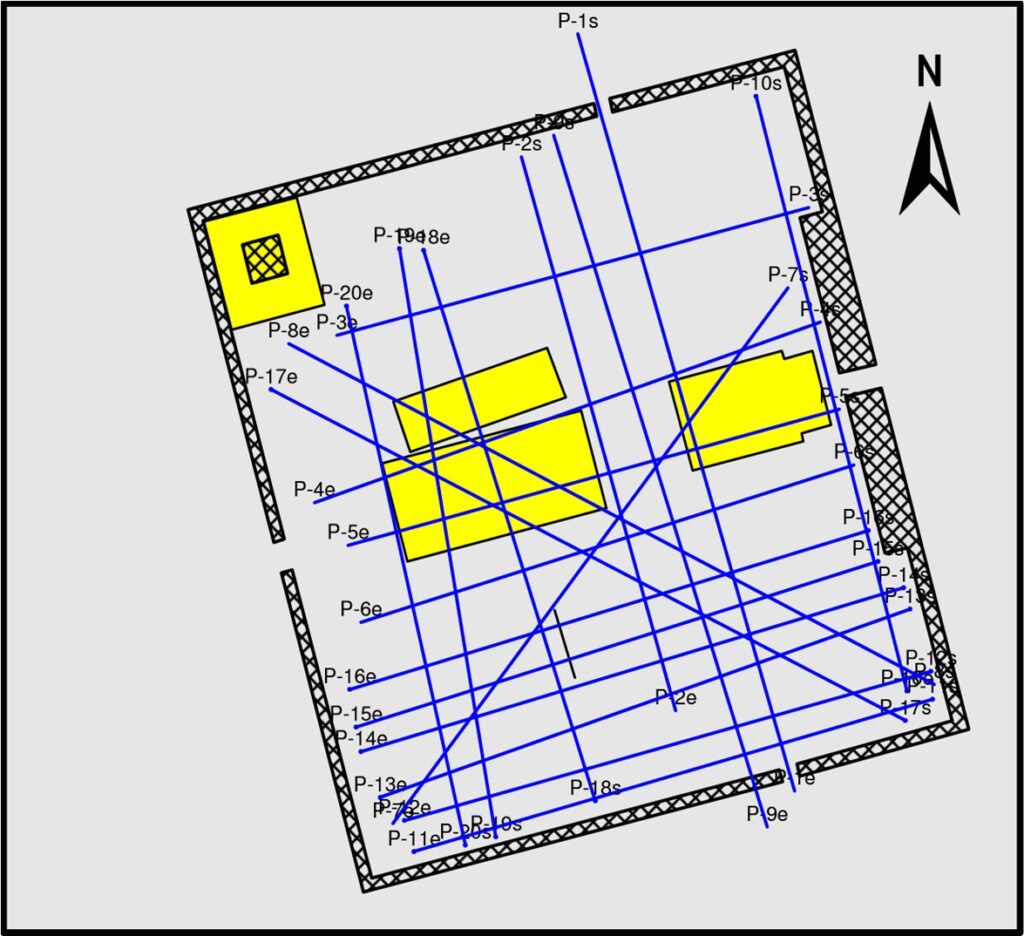
Figure 4: Distribution of the ERT profiles over the temple site.
The magnetic gradiometry was employed on the site to detect small changes in the magnetic field. These changes are indicative of the presence of materials with magnetic properties, such as basalt, granite clay, or iron-containing substances. For instance, the presence of granite building blocks or clay materials bonding limestone blocks can produce distinct magnetic signatures. The magnetic data, usually represented as a 2-D map, provides insights into the magnetic properties of the near-surface. Figure 5 illustrates the use of the magnetometer. The magnetic survey was conducted throughout the entire temple site using the FM-36 gradiometer. The data collection was performed on a grid with a spacing of 0.5 meters, covering the entire temple area in a zigzag pattern. The magnetic sensors were positioned half a meter above the ground surface.
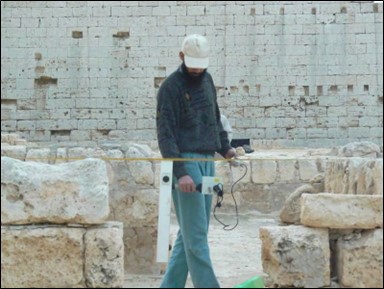
Figure 5: Magnetic Gradiometer FM-36.
The VLF-EM data were collected at the investigated site with a WADI (ABEM) device, which measures the in-phase and out of phase components (Figure 6). Two VLF-EM data sets were measured at the investigated site as shown in Figure (7). Twelve profiles (lines) were measured, extending from East to West passing through a known tunnel at a frequency of 26.6 kHz with line-line offset of 1.0 m and a point-point distance of 1.0 m. At the unknown area (temple of Osiris), thirty-five VLF-EM profiles were measured, extending roughly from East to West at a frequency of 21.7 kHz, where each profile includes 42 measuring points with a line-line offset of 1.0 m and a point-point distance of 1.0 m. For correlation, 2-D resistivity profiles were measured in two directions crossing the temple of Osiris.
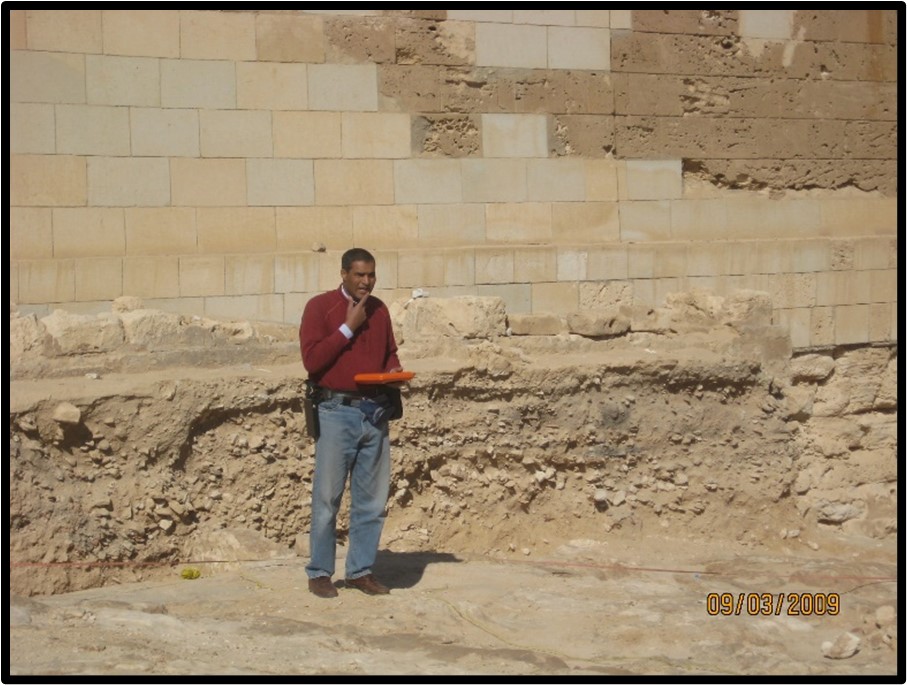
Figure 6: VLF-EM Measurements by ABEM-WADI system.
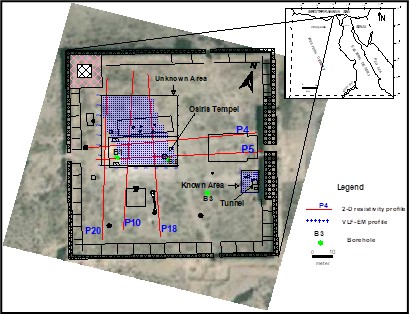
Figure 7: Location map of TapOsiris Magna complex and geophysical survey.
Data Analysis and Results
The collected GPR data underwent processing to eliminate unwanted external interference signals. Subsequently, a time/depth conversion was applied to the entire data set. Figures 8, 9,10 and 11 present examples of GPR profiles taken over the Tap-Osiris Temple. To further analyze the GPR data, time-slicing was performed based on depth for the parallel GPR profiles conducted over the Osiris temple. Samples of the resulting time-slices are displayed in Figures (12 and 13).
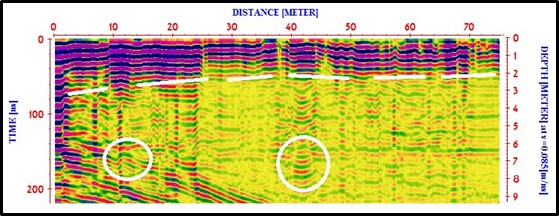
Figure 8: GPR profile “35” of antenna 100 MHz shows minor features.
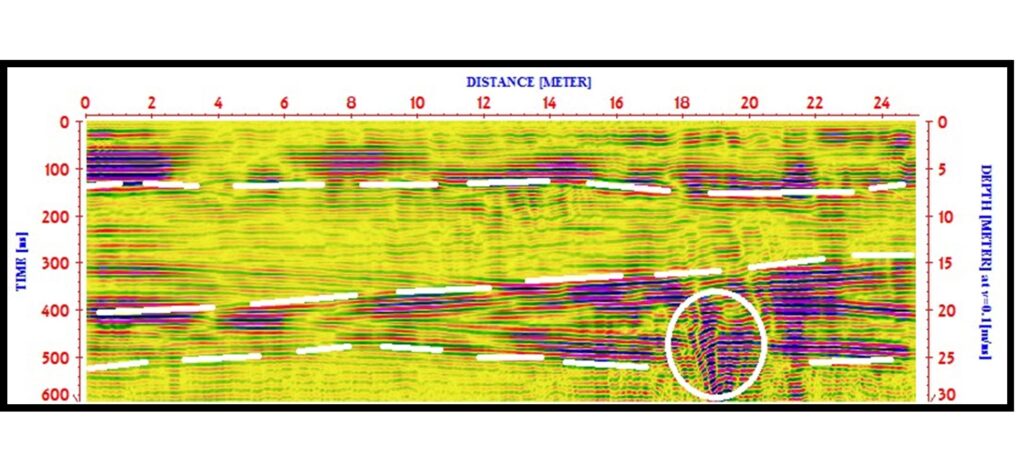
Figure 9: GPR profile “91” over the tunnel of antenna 200 MHz shows a tunnel signature.
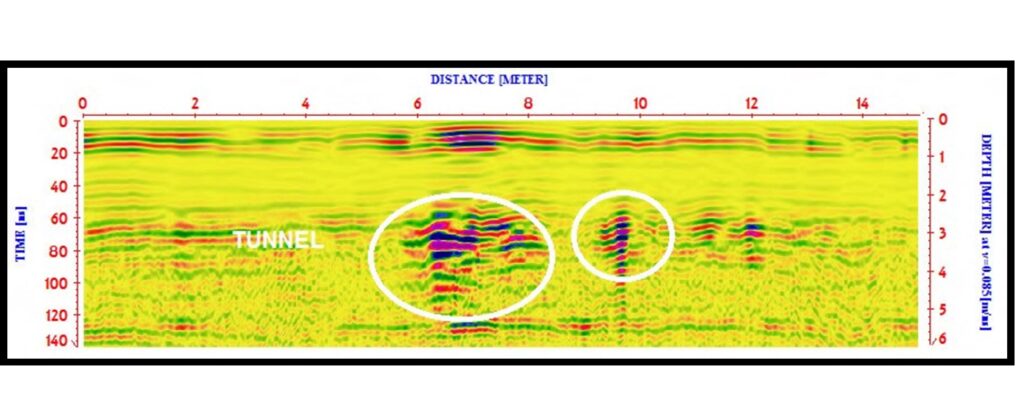
Figure 10: GPR profile “115” of antenna 40 MHz.
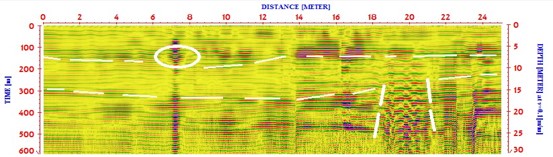
Figure 11: GPR profile “121” of antenna 40 MHz.
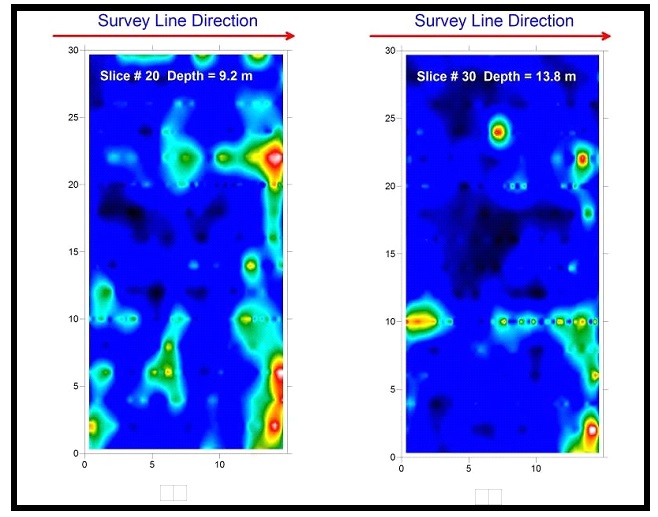
Figure 12: GPR time-slices a) at depth 9.2 m b) at depth 13.8 m.
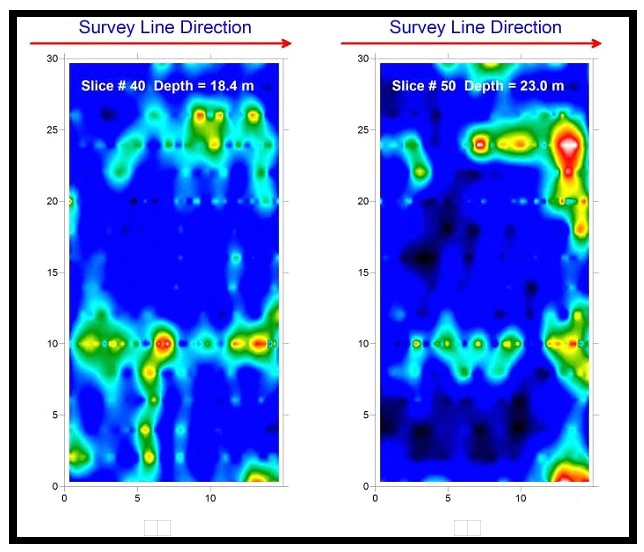
Figure 13: GPR time-slices a) at depth 18.4 m b) at depth 23.0 m.
The ERT data were processed using the RS2DINV software, employing a least square inversion technique and finite difference method, to generate true resistivity tomography sections. Figures 14, 15, 16, 17, 18, and 19 present examples of the ERT profiles These figures reveal significant features that could have archaeological significance. Specifically, ERT profile “P7” (Figure 14) intersects the 8-meter-deep tunnel, and its reflection is clearly visible on the profile.
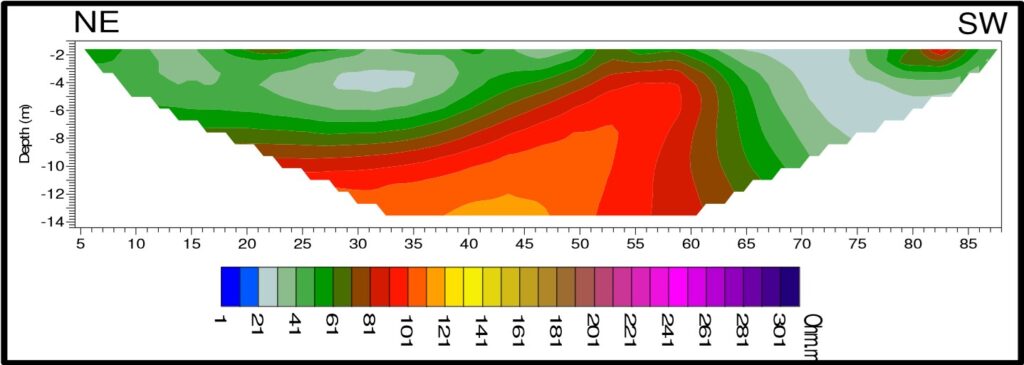
Figure 14: ERT profile P7 passing by part of the tunnel to the south of Osiris Temple.
Profile ERT “P9” (Figure 15) displays a noticeable increase in resistivity with depth, suggesting the possibility of an extension of the tunnel towards the southern area of the Osiris temple.
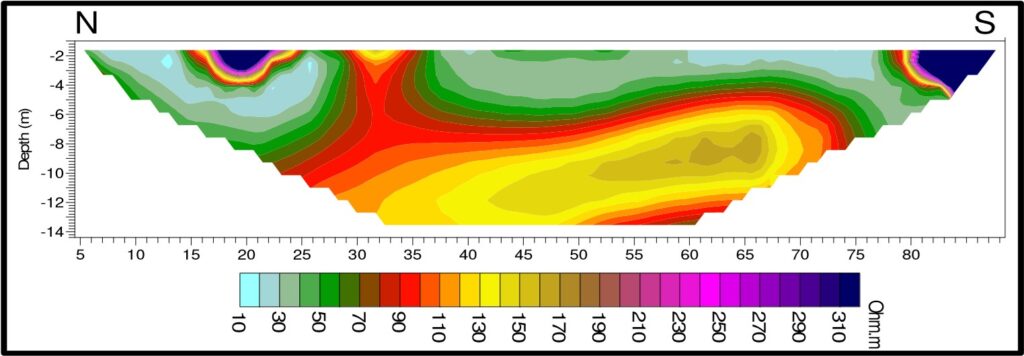
Figure 15: ERT profile P9 passing parallel to the eastern edge of Osiris Temple.
The anomaly that appears at the eastern part of profile ERT “P15” (figure 16) could be attributed to some extension of the tunnel.
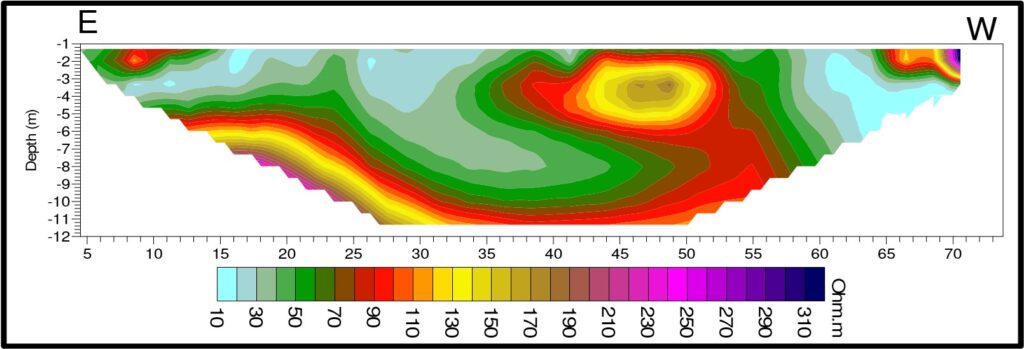
Figure 16: ERT profile P15 passing over the tunnel to the southern edge of Osiris Temple.
Three ERT profiles, namely “P18”, “P19”, and “P20”, cross the Osiris Temple. Notably, these profiles reveal anomalies that are located beneath the Osiris Temple, as depicted in Figures 17, 18, and 19. These anomalies signify potential areas of interest for further investigation.
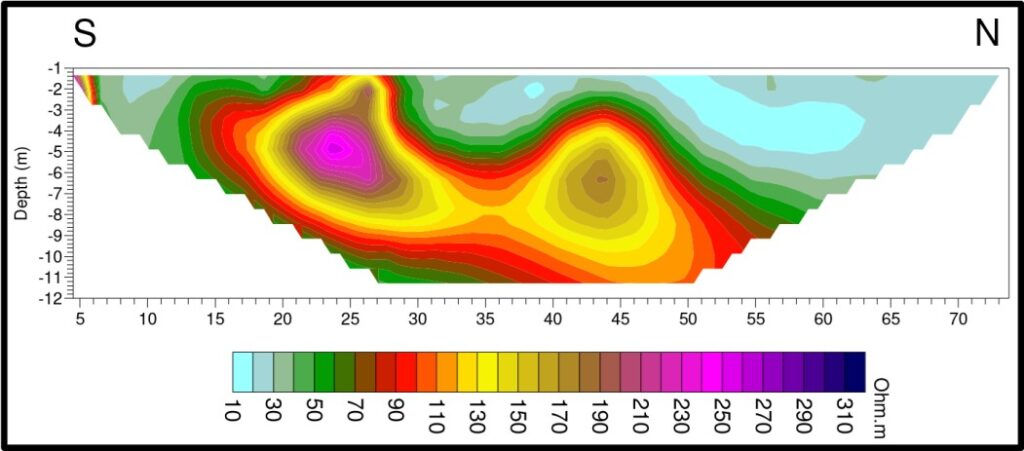
Figure 17: ERT profile P18 passing approximately at the middle of Osiris Temple.
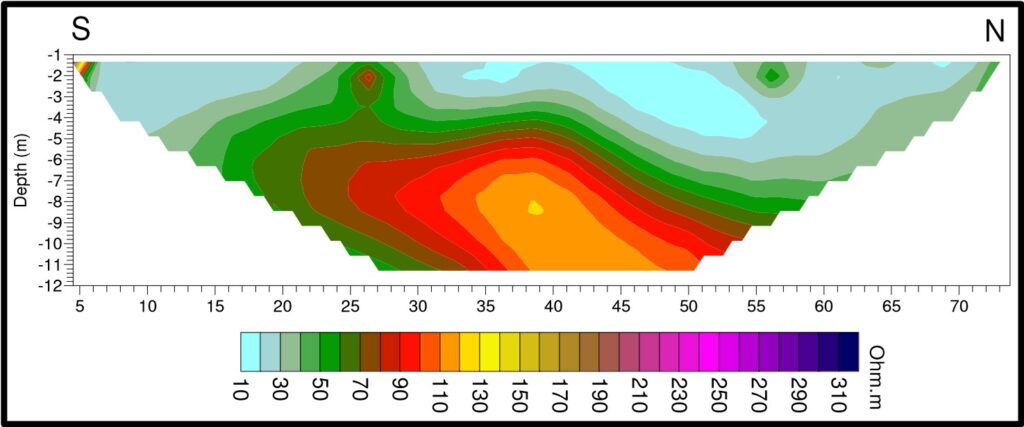
Figure 18: ERT profile P19 passing at the west of Osiris Temple.
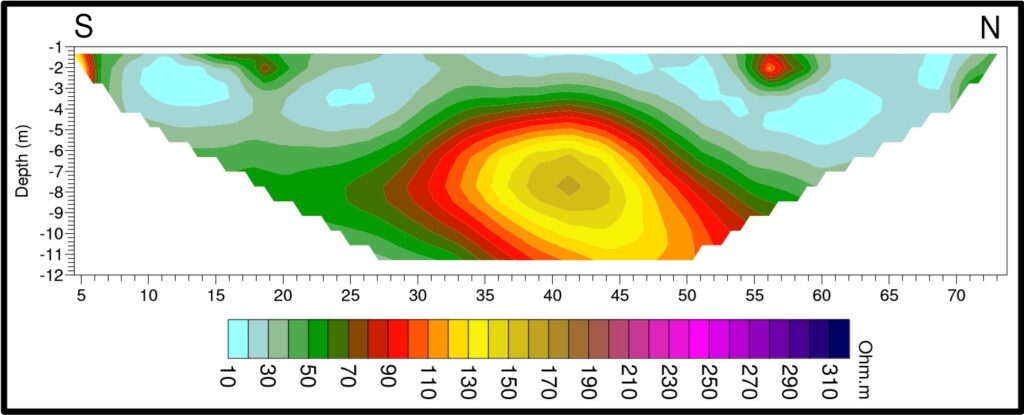
Figure 19: ERT profile P20 passing at the western edge of Osiris Temple.
The magnetic data underwent several processing steps to enhance its quality and remove unwanted artifacts. These steps include:
• Zero Mean Grid (ZMG): This process eliminated grid edge discontinuities by applying a threshold value of 2.5 standard deviations.
• Zero Mean Traverse (ZMT): To remove stripes between traverses, a least mean square fit was employed.
• Clipping: Initially, the data was clipped to eliminate high-frequency signals that could result from surface iron spikes.
• DeSpike Function (K): This step aimed to remove data spikes, further enhancing the data quality and presentation.
• Gaussian Low-Pass Filter (L): Applied to attenuate high frequencies and smooth the data, particularly for weak anomalies associated with deeper archaeological features. The parameters of the Low-Pass Filter were set to X and Y radii of 2.
Figure 20 illustrates the magnetic map of the collected raw data prior to processing, highlighting the need for these processing steps to improve the data quality.
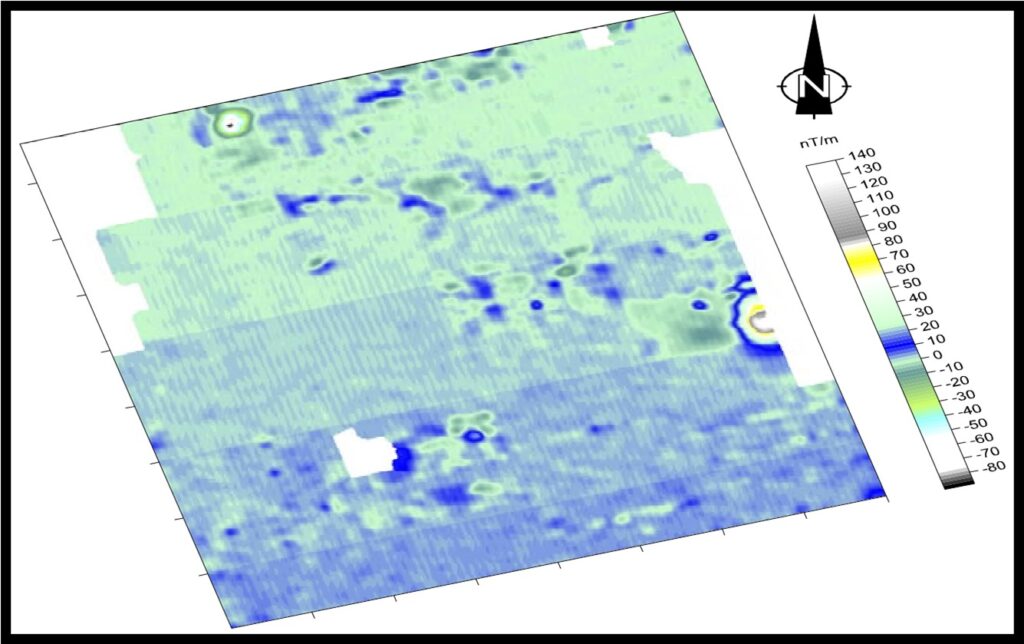
Figure 20: Unprocessed magnetic map over Tap-Osiris Temple site.
Figure 21 displays the resulting map of the magnetic survey after the processing steps. The map reveals surface anomalies that can be attributed to the presence of shattered potteries and metallic-based rocks like granite. These anomalies suggest the possibility of caves filled with a collection of shattered potteries or fragments of granite. The magnetic data provides valuable insights into the subsurface features and helps identify potential archaeological structures or materials in the surveyed area.
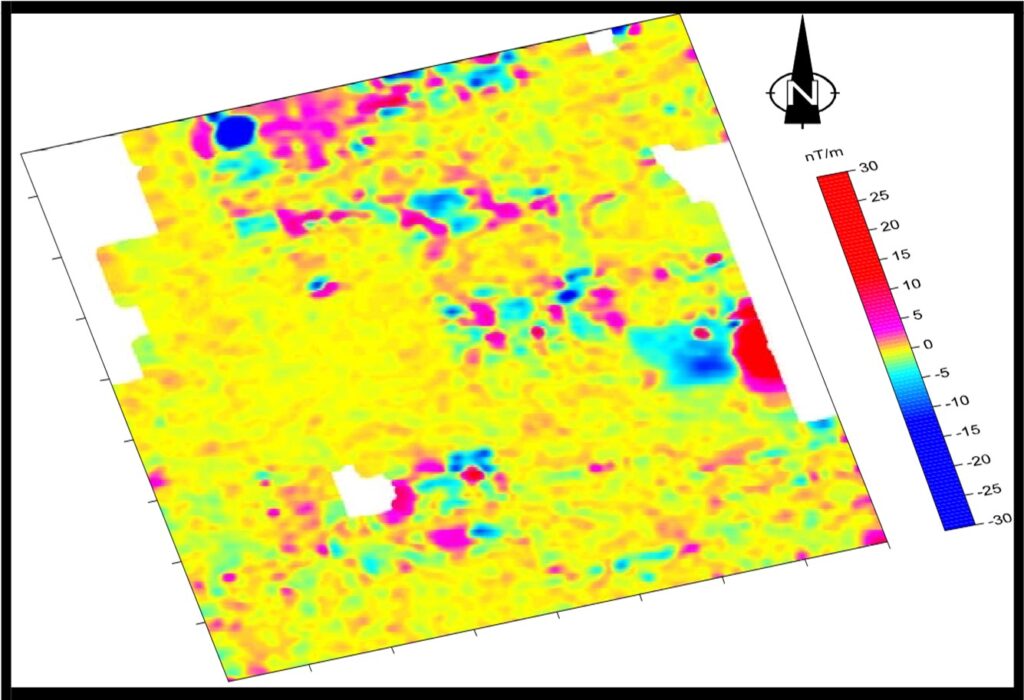
Figure 21: Resulting magnetic map over Tap-Osiris Temple site.
The 12 VLF-EM profiles measured over a known cave were qualitatively analyzed by applying the Fraser filtering (Fraser, 1969) to check the capability of VLF-EM data processing and interpretation to outline the borders of this cave. After that, the 35 VLF-EM data profiles, measured in unknown area (temple of Osiris), were undergone qualitative and quantitative analyses.
The results of application of the Fraser filter to the 12 VLF-EM profiles are plotted in a map to show the spatial distribution of the conductive and resistive zones (Figure 22). From the map, the zero contour line separates between the positive Fraser filter VLF-in phase (VIP) component that is corresponding to conductive anomalies and the negative ones that are corresponding to resistive anomalies. There is a significant negative Fraser VIP zone extending N-S direction, which is tentatively associated with a resistive zone, extending from south to north tracing the cavity zone. Comparing between Fraser filter VLF-in phase (VIP) map (Figure 22 c) and in-phase component map (Fig.22 b) shows the advantages of Fraser filter in tracing resistive zone of the cave and conductive zones around. Plotting the Fraser filter VLF-in phase (VIP) map (Figure 22 c) in the location map shows quiet well matching between the cave and the surface terrains such as stairs.
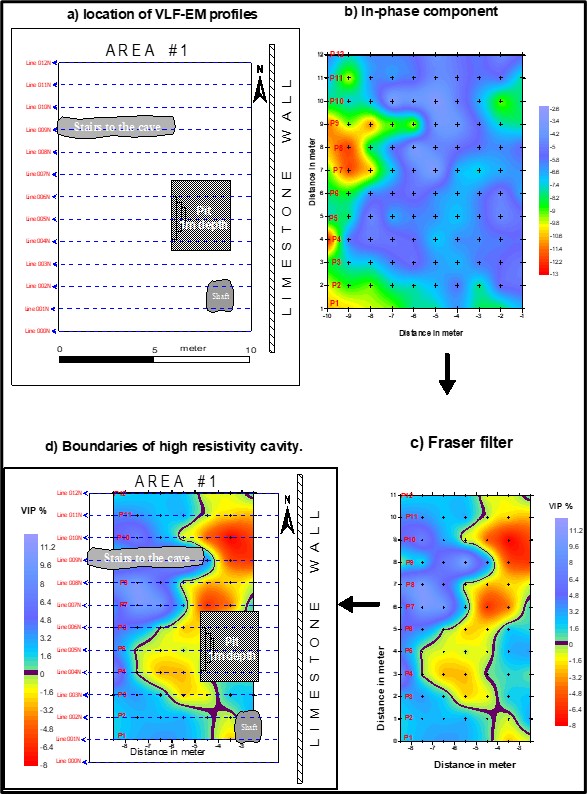
Figure 22: A-VLF-EM profiles in area-1 (known area), b- in-phase and c-Fraser filter of the data.
The Fraser filter (Fraser 1969) was applied to the 35 profiles of the unknown area. Figure (5) is a contour map collects the filtered data of all profiles.
From Figure 23 there is obvious contrast between resistive and conductive zones in the area. The area could be separated into two zones. The first zone begins from profile 0 to 20, which is characterized by a large resistive zone, about 20 m length x 15m width in contact with a conductive zone, approximately the same size. This zone is located directly on the Osiris temple, the proposed location of tomb of Cleopatra, and Mark Anthony. The second zone begins from profile 21 to 35. This zone is characterized by a large number of intercalated resistive and conductive elongated pathways. The resistive zones in Figure 23 may refer to a subsurface cavities and tunnels and/or lithologic variations in the limestone bed rock.
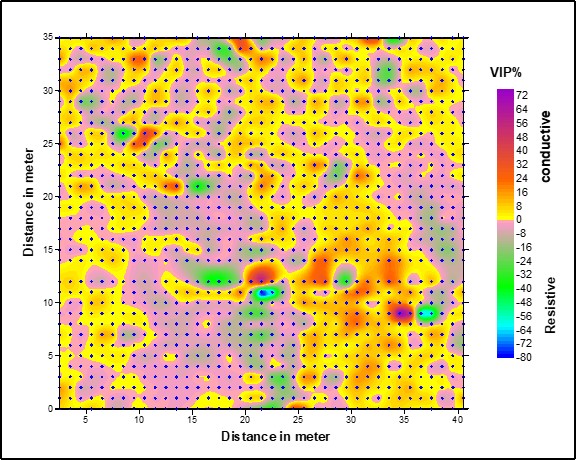
Figure 23: Fraser filter of the unknown area, proposed location of tomb of Cleopatra, and Mark Anthony under Osiris temple.
The quantitative interpretation of the VLF-EM data was conducted by Inv2DVLF software developed by Santos (2006) for interpretation of the single-frequency VLF-EM data via an inversion of the tipper data using a 2D regularized inversion approach (Sasaki 1989, 2001).
The thirty-five VLF-EM profiles of the unknown area have been inverted using Inv2DVLF software. Environmental resistivity of 300 Ohm*m has been selected based on the measured 2-D resistivity cross-sections. Due to the large number of profiles, they were gathered in horizontal maps for given levels (Figure 24).
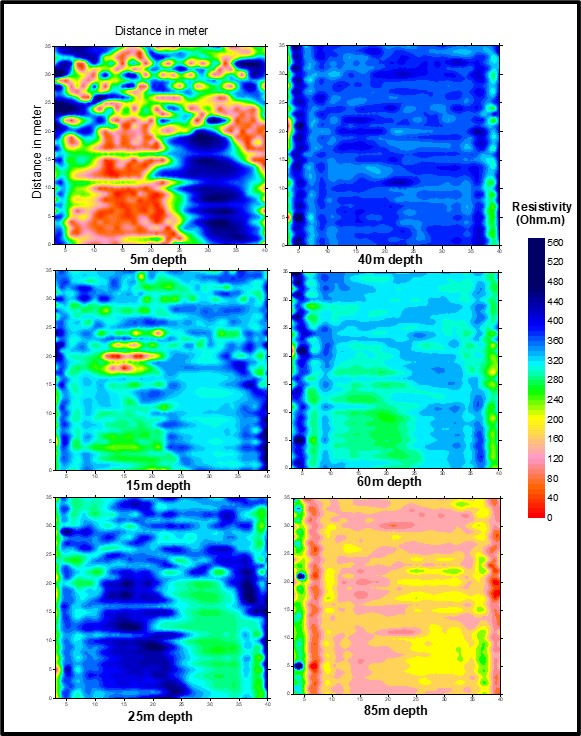
Figure 24: Inversion of VLF-EM profiles in maps at different levels.
Inspection of the quantitatively interpreted VLF-EM via Inv2DVLF software in Figure 24 shows that there are two subsurface high resistivity zones beneath Osiris temple, the proposed place of Cleopatra and Anthony tombs. The first one (shallow) appears at about 5-meter depth as shown in the left- hand side of Figure 24 in the map of 5 m depth. This resistive zone could be interpreted as a lithologic heterogeneity because there is a disagreement between the Fraser filtering results and the results of data inversion. The second one (deep) begins from 25m depth and extended to 45 m depth. There is a good matching between the Fraser filter map and inverted VLF-EM data map at 25m (Figure 24) which may indicate a major cavity zone in this area at a depth between 25 to 45m.
Discussion and Conclusions
The data collected in Phase-I from various sensors (GPR, ERT, MAG) indicated high-quality data with minimal noise or interference. Examination of the data over a known tunnel revealed consistent signatures on both the radar and ERT data. This information could serve as a reference for comparing the data returns in other regions.
Following a rule that considers only features exhibiting anomalous behavior from two or more independent methods, three zones were identified as potential areas of interest. Two of them were located within the temple of Osiris, and the third zone was located to the south of the known tunnel. Analysis of the GPR and resistivity data revealed that the two zones within the Osiris temple exhibit anomalies and warrant further investigation (Figures 25 and 26). These areas, located along the mid-line of the western edge and approximately 20 meters deep in the southeast corner of the temple, show promising indications of potential archaeological features. Moreover, the magnetic survey and subsequent digging procedures have led to the discovery of various relics at the site.
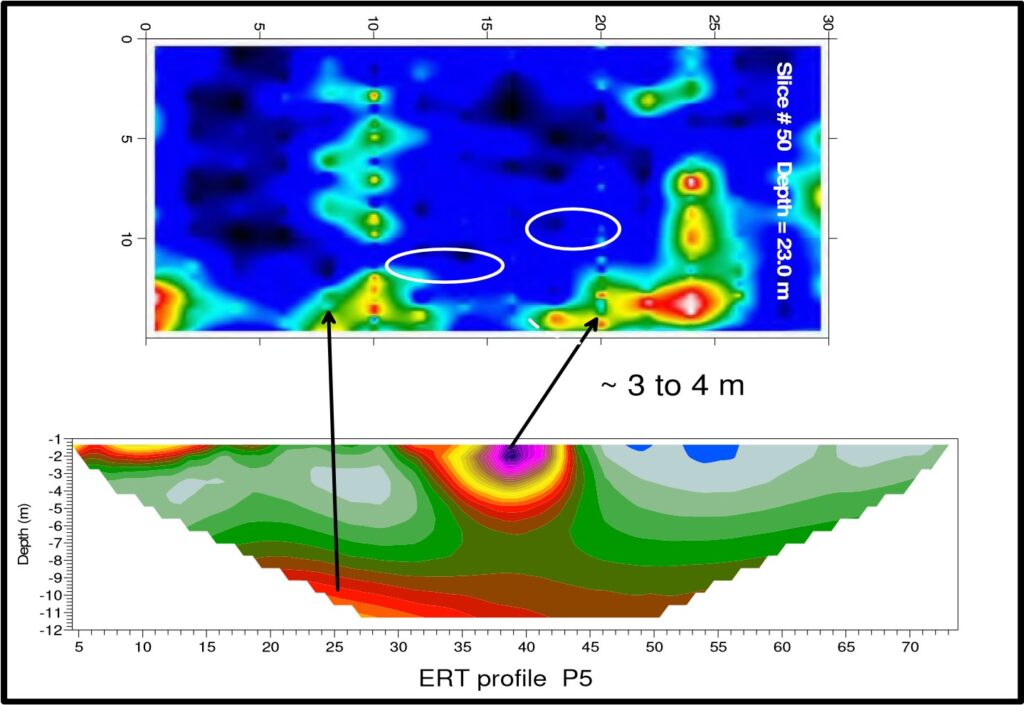
Figure 25: GPR and ERT anomalies over the SE corner of Osiris Temple.
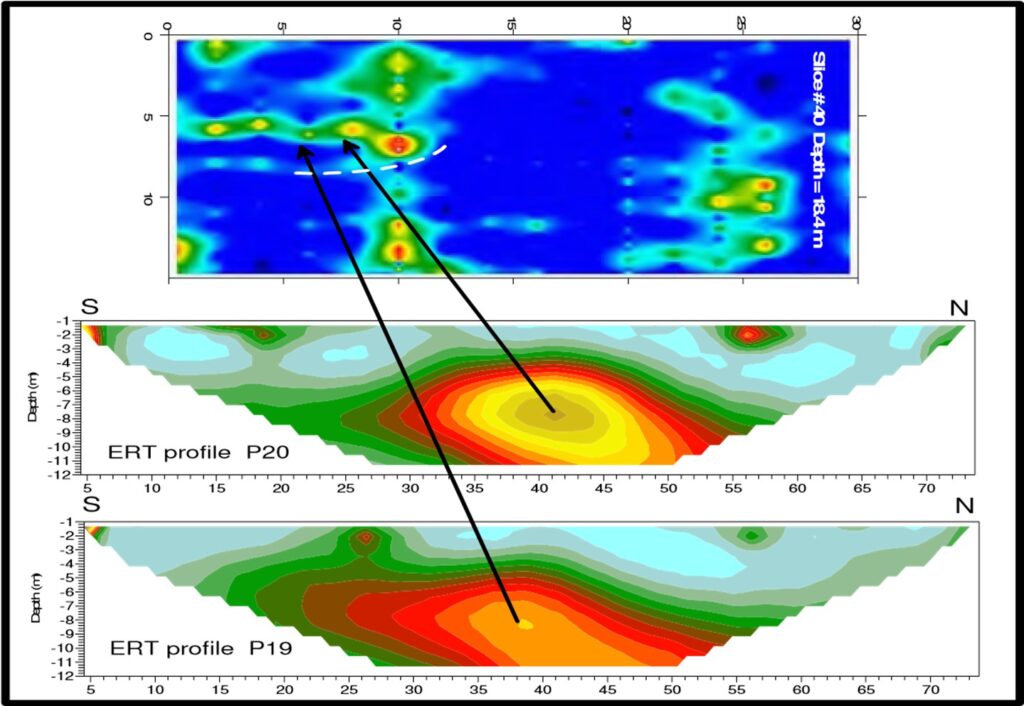
Figure 26: GPR and ERT profiles at the west of Osiris Temple.
Based on the above-mentioned findings, it has been recommended to drill some boreholes to either directly penetrate the suspected cavities or provide access for specialized borehole sensors. This approach allows for a more focused and targeted investigation, providing the opportunity to detect any nearby structures or confirm the presence of archaeological features. Locations of the proposed boreholes are shown by the blue asterisks in Figure (27) with the first priority to the two locations inside the Osiris Temple.
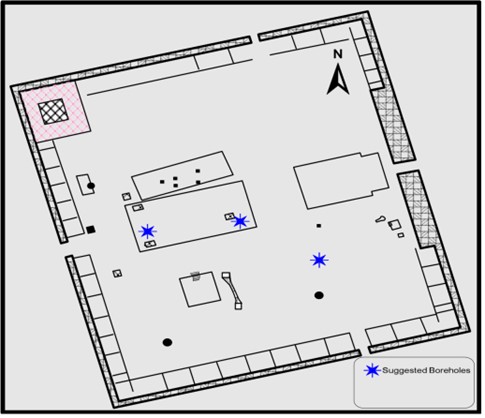
Figure 27: Location map of the suggested boreholes.
The drilling operation was carried out in the presumed locations identified through the integration of GPR and resistivity data. The drilling was conducted manually, taking precautions to prevent any damage or destruction that could occur with mechanical drilling methods. The boreholes were drilled to a depth of 30 meters to thoroughly investigate the subsurface. To further examine the drilled boreholes (Figure 28), a special camera was attached to a cable and lowered down to the bottoms of the boreholes. The purpose of this camera inspection was to visually inspect the interior of the boreholes and identify any unfilled spaces or rooms that could indicate the presence of archaeological features.
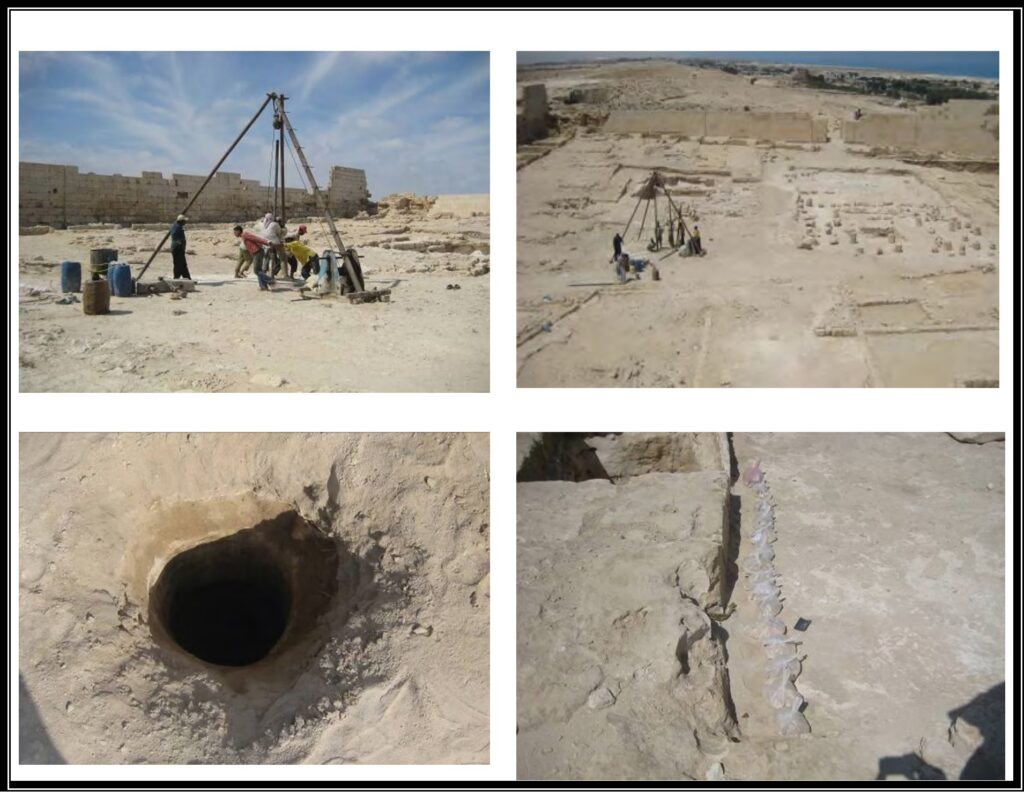
Figure 28: Digging of boreholes at Tap-Osiris Magna temple.
However, upon examination of the borehole camera footage, no unfilled spaces or rooms were detected. This means that no significant cavities or structures were found within the drilled boreholes. As a result, the high resistivity anomalous spots observed on the ERT profiles may be attributed to the intrinsic characteristics of the limestone bedrock of the temple rather than indicating the presence of archaeological features. It is important to know that geological factors, such as variations in the limestone composition and natural features of the bedrock, can produce anomalies in resistivity data. These anomalies do not necessarily signify the presence of archaeological structures but rather reflect the natural impact of the geological formations. They introduce a noise element into the findings, but do not in any way negate the capability of these techniques to detect significant archeological structures.
Despite the absence of significant archaeological features in the drilled boreholes, the outcome of the borehole inspection highlights the importance of considering geological factors and interpreting the anomalies observed in geophysical data within their proper context. Also, it provides valuable information for understanding the subsurface characteristics of the temple site. Moreover, it encouraged us to proceed further through Phase-II for exploring the potentiality of Osiris temple area to embrace hidden archaeological structures by another geophysical technique; the very low-frequency electromagnetic (VLF-EM).
The phase-II was started by measuring and analyzing VLF-EM profiles over a known cave to check the capability of VLF-EM data processing and interpretation to outline the borders of this cave. The analyzed data have successfully traced out the resistive zone of the cave and conductive zones around. Also, it shows quiet well a match between the cave and the surface terrain features such as stairs. The next step was executed by measuring closely-spaced VLF-EM data profiles over the temple of Osiris. Qualitative and quantitative interpretation of VLF-EM revealed two subsurface highly resistive zones beneath Osiris temple, the suggested place of Cleopatra and Anthony tombs. The shallow zone could be interpreted as a lithologic heterogeneity because there is a disagreement between the Fraser filtering results and the results of data inversion. The deeper zone begins from 25m depth and extended to 45 m depth. There is a good agreement between the Fraser filter map and inverted VLF-EM data map at 25m which may indicate a major cavity zone in this area at a depth between 25 to 45m.
Accordingly, results of Phase-II expect a presence of a cavity zone from 25 to 45 m depth in the southwestern zone of Osiris temple; especially since this depth has not been reached by drilling and agrees well with the archeological expectations. We expect that this proposed tomb is accessed by a subsurface tunnel opening outside the TapOsiris Magna complex. We hope the site may be excavated in the future based on these geophysical findings. Moreover, it is crucial to continue refining and integrating geophysical approaches with other archaeological methodologies to maximize the chances of discovering significant historical artifacts or structures in the future.
References
Fraser, D.C., 1969, Contouring of VLF-EM data. Geophysics 34, p. 958-967.
Sandmeier, K.J., 2001, Program for Processing and Interpretation of Reflection and Transmission data, D-76227 Karlsruha, Germany.
Sasaki, Y., 1989, Two-dimensional joint inversion of magnetotelluric and dipole–dipole resistivity data. Geophysics 54, p. 254–262.
Sasaki, Y., 2001. Full 3-D inversion of electromagnetic data on PC., Journal of Applied Geophysics, 46, p. 45–54.
Authors’ Bios

Abbas Mohamed Abbas
In 1988, Dr. Abbas embarked on his research journey at the National Research Institute of Astronomy and Geophysics (NRIAG) in the role of an Assistant Researcher. This marked the inception of his influential career in the field. His educational background includes a Bachelor of Science (B.Sc.) degree earned in 1987 and a Master of Science (M.Sc.) degree obtained in 1994, both from Cairo University. In 1998, he successfully achieved his doctoral degree in Geophysics from Giessen University, Germany, a notable accomplishment facilitated by the esteemed DAAD funding program. From 2001 to 2003, he further honed his expertise through a postdoctoral fellowship at the Tokyo Institute of Technology (TIT), Japan. In recognition of his exceptional contributions, Dr. Abbas attained the title of Professor in 2011, a testament to his unwavering commitment and pioneering contributions. Dr. Abbas boasts a remarkable record of over 42 scientific papers published in renowned and esteemed journals. Additionally, he has actively contributed to numerous research and consultancy projects, with a particular focus on the field of archaeo-geophysics. Presently, he holds the distinguished role of Deputy within the Geomagnetic and Geoelectric Department at the National Research Institute of Astronomy and Geophysics.

Hany Salah Abdel Azeem Mesbah
Born in Giza Governorate in Jan. 1970, Graduated from Geophysics Department, Faculty of Science, Cairo University 1992. has started his career as assistant researcher in Geoelectric and Geothermic Lab., Geoelectric and Geomagnetic Department, National Research Institute of Astronomy and Geophysics (NRIAG), Helwan. Has promoted in my position till be professor of applied and environmental geophysics in my Lab. Has more than 30 research paper published in national and international journals. Supervised more than 10 M.Sc. and Ph.D. theses, and Basic member of all consultants and projects in his laboratory.
Usama Massoud
Usama Massoud occupies the position of professor of Applied and Environmental Geophysics at the Geoelectric and Geothermic Laboratory, National Research Institute of Astronomy and Geophysics (NRIAG). Prof. Massoud has vast experience spanning more than 25 years with integrated geophysical applications in groundwater studies, archaeology, geoenvironmental investigations, and geotechnical assessment of engineering sites. Prof. Massoud is an expert in a variety of geophysical techniques, including DC resistivity, time-domain induced polarization, self-potential, transient electromagnetic, terrain conductivity measurements, very low-frequency EM/R, and audiomagnetotelluric methods. He participated in more than 30 research projects and consultations conducted by the home institution on behalf of the national authorities. His contribution included planning of field campaigns, data acquisition, data processing/interpretation, and reporting.

Ahmed Lethy
Professor of Applied Geophysics, currently serves as the head of the National Data Center at the National Research Institute of Astronomy and Geophysics (NRIAG), Helwan, Egypt. Beyond his academic pursuits, he takes immense pride in being a Certified Surrogate Inspector associated with the Comprehensive Nuclear-Test-Ban Treaty Organization (CTBTO).
Ahmed El Kotb El Emam
Ahmed El Kotb El Emam is Professor of Applied Geophysics with extensive research and consultation capabilities in various geophysical aspects including engineering geophysics, environmental geophysics, archaeological geophysics, borehole geophysics, marine magnetism, near-surface geophysics, image processing, and related geophysical studies.

Mohamed Khalil
Mohamed Khalil has a Ph.D. in Geoscience from Justus Liebig University, Germany. He finished his postdoctoral scholarship at the Center of Geophysics, University of Lisbon, Portugal. Mohamed Khalil’s research focuses on near-surface applied geophysics. He uses self-potential, electrical resistivity tomography, and electromagnetic methods for solving archaeological, hydrogeological, engineering, environmental, and geohazards problems.

Roger S. Vickers
Dr . Vickers earned his Ph.D. in Physics at the University of Southampton in 1963. After relocating to the USA, he worked at a number of research institutions on developing Remote Sensing techniques and equipment , culminating in 27 years at Stanford University and Stanford Research Institute, where he worked primarily on developing equipment and applications for airborne Penetrating Radar used for imaging beneath the ground and beneath foliage cover. The applications included the use of GPR in both military and civilian sectors in Egypt, Ecuador, USA and the UK. He has been active for over 50 years in geophysical conferences involving GPR, and is the author of multiple papers on related topics. He is presently retired and living in Norway.
