
By Laila Esa Muharani1, Muh. Sarkowi2, Selvi Misnia Irawati1
1Geophysical Engineering, Sumatra Institute Of Technology
2Department of Geophysical Engineering, Faculty of Engineering, Lampung University
Abstract
Sumatra is one of Indonesia’s regions with potential for geothermal resources, especially those related to young volcanoes. One of these is the Bonjol geothermal area in the Bonjol District, Pasaman Regency, West Sumatra Province. This study aims to delineate the fault structure or rock lithology of the Bonjol geothermal area based on GGMplus gravity data using the Second Vertical Derivative (SVD) method and perform inverse modeling to determine the distribution of subsurface density. The results showed that the complete Bouguer anomaly values in the study area ranged from -20 mGal to -2 mGal, with regional anomaly values ranging from -18 to -6 mGal and residual anomalies of -5.5 to 5.5 mGal. The SVD map shows the similarity in direction to the structure on the geological map, namely northwest-southeast and southwest-northeast. The inverse modeling results show that the density distribution of the Bonjol geothermal area ranges from 1.8 to 3 gr/cm3, with the alleged heat source being under the manifestation of Takis and Limau hot springs with a density of 2.8 gr/cm3. The clay cap is located at a depth of 0 to 800 meters which is thought to be an altered Maninjau Pyroclastic Flow (Qapm). The reservoir is considered lava rock or sedimentary rock of the Sihapas Formation that has undergone tectonic deformation.
Introduction
Sumatra is one of Indonesia’s regions with the potential for geothermal resources, especially those related to young volcanoes. In addition, there are structures in the form of regional faults related to the Sumatran Fault system. One of these potentials is the Bonjol geothermal area in Bonjol District, Pasaman Regency, West Sumatra Province. Surface manifestations in this area are hot springs found at four locations, namely Padang Baru hot springs, Limau hot springs, Takis hot springs, and Kambahan hot springs. The Bonjol geothermal area is surrounded by a quaternary volcanic complex with stratigraphy that tends to be dominated by quaternary volcanic rocks in the form of lava and pyroclastic rocks, as shown in Figure 1.
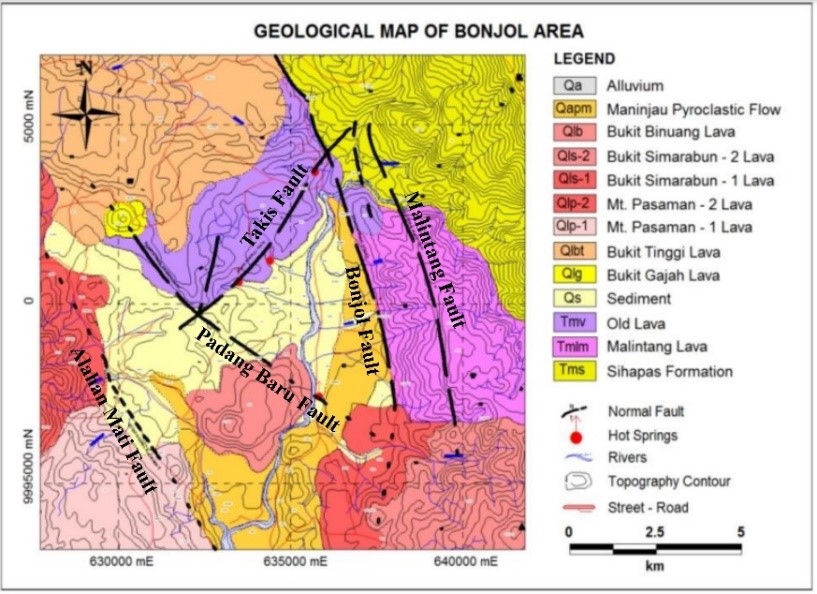
Figure 1 Geothermal geological map of Bonjol (Joni and Hermawan, 2020)
The results of an integrated investigation by the Indonesian Geological Resources Center in 2007 identified five fault structures in the Bonjol geothermal area. The Malintang, Bonjol, Alahan Mati, and Padang Baru faults are relatively northwest-southeast, while the Takis fault has a southwest-northeast direction. Indications of geological structures in the form of faults in the Bonjol geothermal area are characterized by rock destruction zones, joints, and manifestations of hot water and altered rocks. This geological structure will be a medium for hydrothermal transportation to the surface.
The magnetotelluric survey by Sugianto and others (2015) shows that the conductive layer around Padang Baru, Sungai Limau, and Takis is a hydrothermal alteration zone, with the top reservoir located at a depth of 800 meters. The potential heat source is estimated to be located at a depth of ± 3000 meters as an intrusion of andesite igneous rock resulting from the Bukit Gajah eruption in the Quaternary period. Based on its components, the geothermal system in the Bonjol area is distributed along the graben structure, which is part of the Sumatran Fault system (Hutapea, Soemintadiredja and Permana, 2010). The Bonjol geothermal system is indicated to be hot water dominated because the manifestations of hot springs in the area tend to be dominated by chloride types and are located in partial equilibrium (Kusnadi and Risdianto, 2007).
Data
This study uses secondary data in the form of gravity disturbance GGMplus data. The data used in this study is 3906, with an area of 14 km × 14 km. GGMplus (Global Gravity Model plus) combines the gravity of the GRACE and GOCE satellites, EGM2008, and the gravitational effects of shortwave topography at a resolution of about 200 m for all terrestrial and near-coastal regions of the Earth between ±60° latitude. GGMplus includes data on gravitational acceleration, radial and horizontal field components, and quasi-geoid elevation, with over 3 billion points covering 80% of Earth’s surface mass (Hirt, 2012).
Methods
This research used the SVD method to obtain additional information from lithological boundaries or subsurface structures. High gradients can be associated with the high contrast of subsurface physical properties and vice versa. The value of the gradient is usually used to describe the boundaries of the source of the anomaly. The SVD technique uses a Henderson & Zietz (1949) filter operator with residual anomaly as the input. The subsurface density distribution model in the research area was estimated using inverse modeling with residual anomaly as the input. The inversion modeling was carried out using Grablox 2.1 software, with the major block size having a length of 14 km easting (X) and 14 km northing (Y) with an initial density value of 2.4 gr/cm3. The subsurface model was obtained from a compilation of SVD and inverse modeling results. Then the subsurface structure model was correlated with the MT model (Joni and Hermawan, 2020) to produce a cross-section of the Bonjol Geothermal System Model.
Results and Discussion
Based on Figure 2, the complete Bouguer anomaly values in the study area range from -20 mGal to -2 mGal. The low gravity anomaly is in the middle of the study area where the manifestation is observed. It may be the result of the response of lava rock that has undergone a high weathering process or the presence of sedimentary rocks.
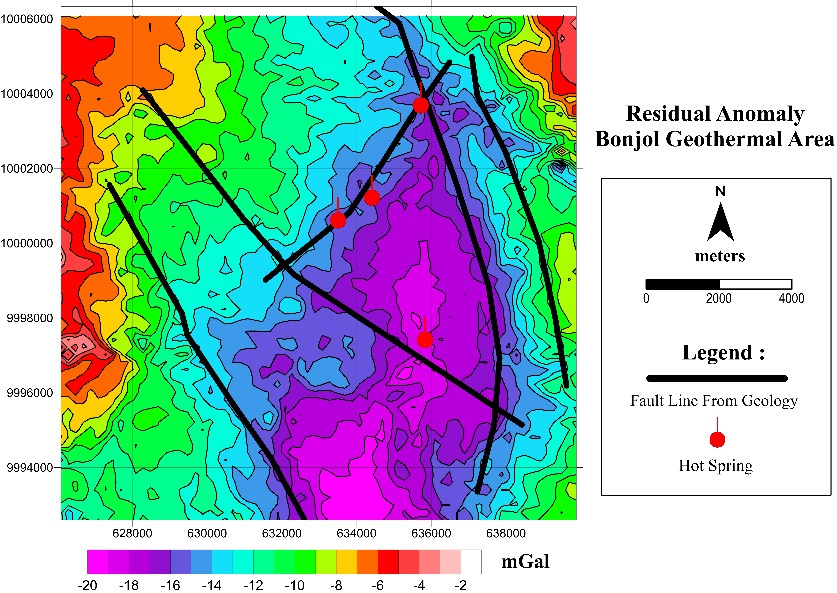
Figure 2 Complete bouguer anomaly map
High gravity anomalies dominate the study area to the west, northwest and northeast. These anomalies are interpreted to originate from lava rock, which tends to be fresh and massive. The residual anomaly map shows that the distribution of subsurface anomalies are in the direction of the fault structures. This is an indication that the distribution of the anomalies are influenced by fault structures in the area.
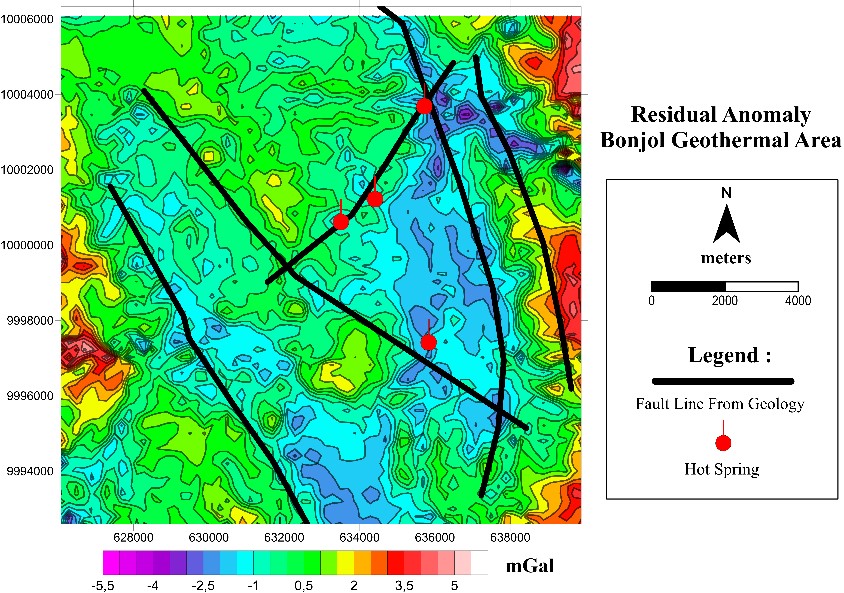
Figure 3 Residual anomaly map
The SVD map in Figure 4 shows similarity in the direction of the structures as indicated on the geological map, namely northwest-southeast and southwest-northeast. There are some differences between the presence of geological faults and faults identified using SVD, especially in the Bonjol Fault, Takis Fault, and Malintang Fault. The difference is thought to represent a shift between the geological faults identified at the surface and the SVD at the subsurface. The faults identified at the surface in the study area are normal faults.
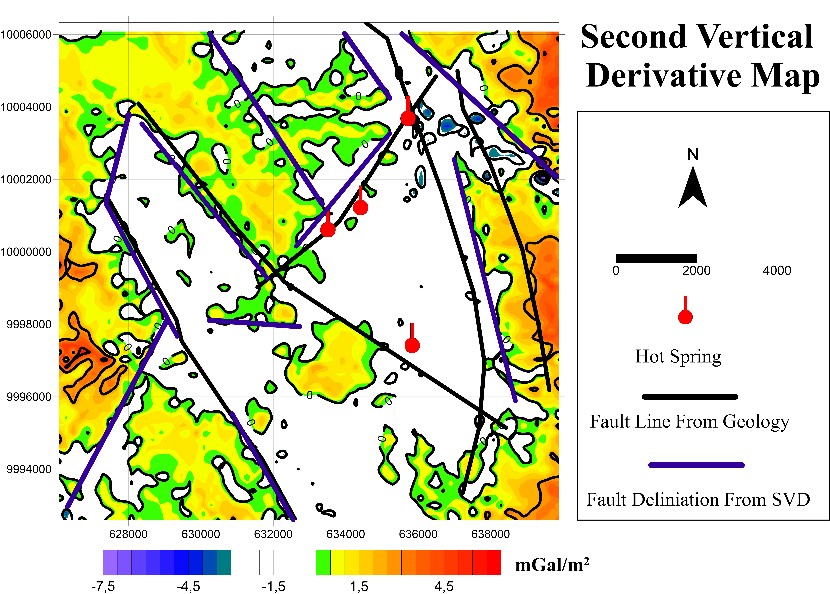
Figure 4 Second vertical derivative map
The density distribution map with an elevation of 0 meters from MSL in figure 5, shows a low density (< 2.25 gr/cm3), which is dominant in the middle, covering all manifestation areas. The distribution of this low-density value follows the pattern of geological fault structure, which indicates that the fault controls the extent of influence of hydrothermal alteration.
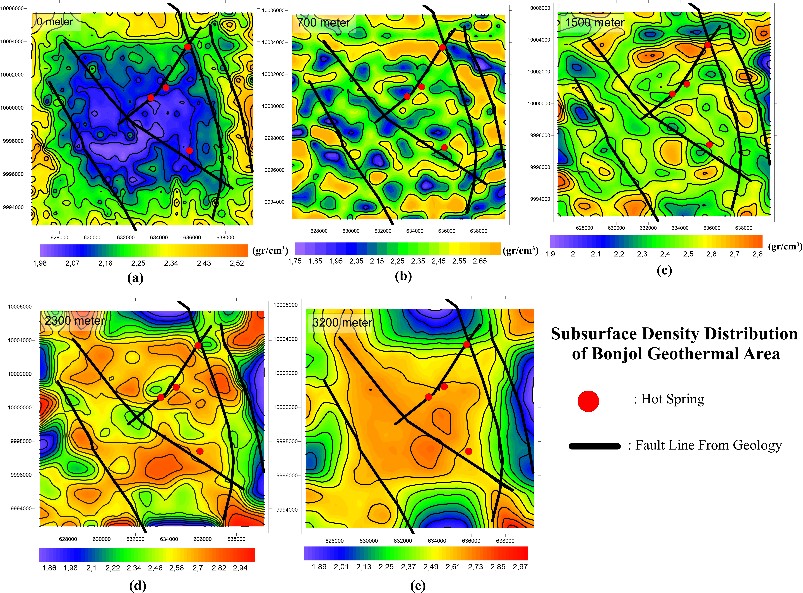
Figure 5. The result of inversion modeling is a density distribution. (a) At an elevation of 0 meters, (b) At a depth of 700 meters, (c) At a depth of 1500 meters, (d) At a depth of 2300 meters, and (e) At a depth of 3200 meters.
Line 1 cross-section has a similar pattern to the magnetotelluric cross-section results. The low-density layer is a clay cap layer at a depth of 0 to 800 meters with a low resistivity value (<10 m), as indicated by the magnetotelluric model. The layer with a high density at a depth of 3000 meters is thought to be the Binuang Lava Unit.
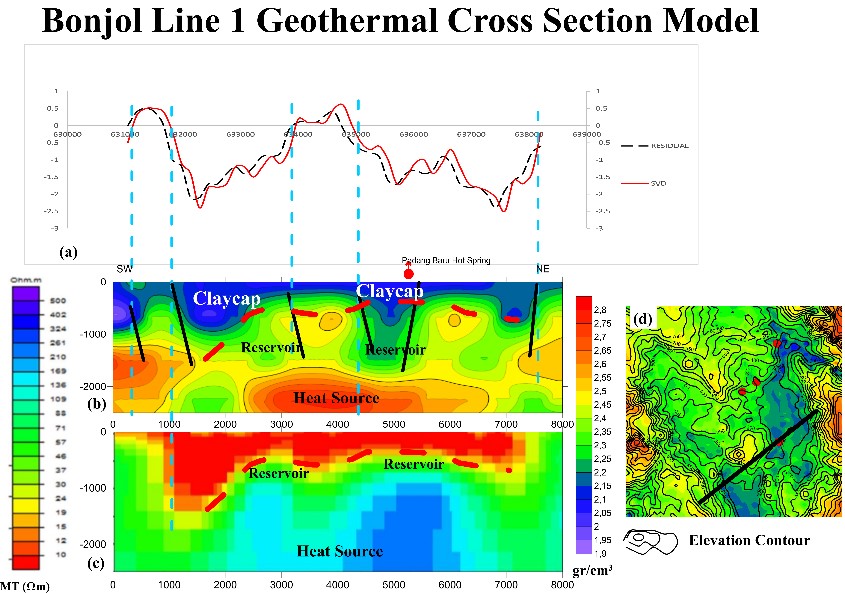
Figure 6 Geothermal section of Bonjol line 1. (a) Cross section of residual anomaly, and residual gravity anomaly SVD, (b) Subsurface density distribution model resulting from inversion 3D modeling, (c) Resistivity distribution model from MT modeling, (d) Residual map.
The cross-section of line 2 in Figure 6 has a length of 10 Kilometers in a southwest to northeast direction. The heat source is thought to be at a depth of 3000 meters, probably a rock intrusion. The geochemical and geological analysis results show high Li (Lithium) and Fe (Iron) content in the area. This heat source is estimated to come from the northwest direction of the study area, where the area shows the presence of high anomalies caused by intrusive rocks at high temperatures.
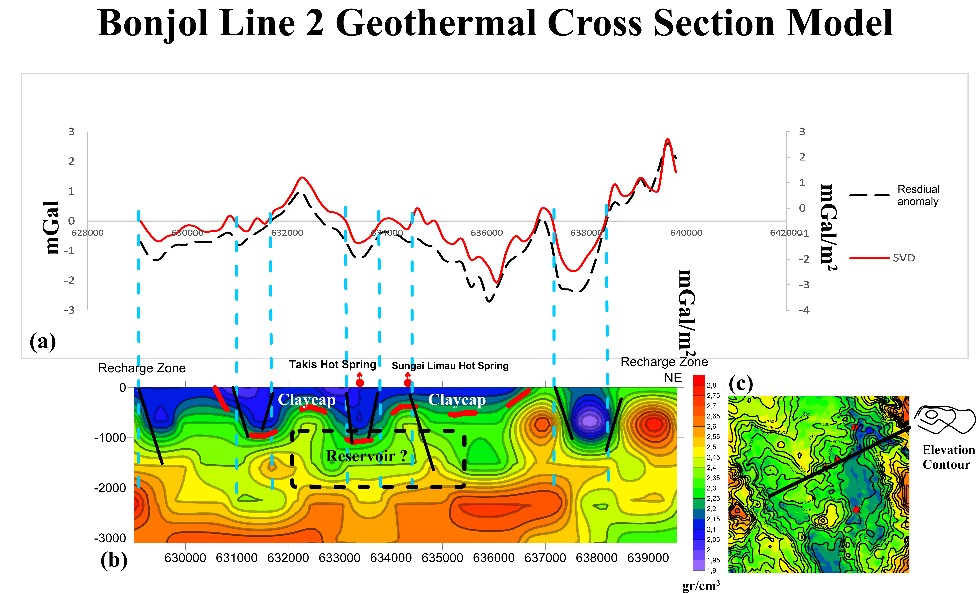
Figure 7 Geothermal section of Bonjol line 2. (a) Cross section of residual anomaly, and residual gravity anomaly SVD, (b) Subsurface density distribution model resulting from 3D modeling inversion, (c) Residual map.
The reservoir layer is estimated to sit at depths from 800 meters to 2000 meters. It is thought to be lava rock or sedimentary rock of the Sihapas Formation that has undergone tectonic deformation resulting in secondary permeability in the form of faults or fractures. The possible presence of rock structure and contact in the cross-section of line 2 is indicated by a density contrast curve and a derivative analysis curve, where the SVD curve shows a value of 0.
Conclusions
Based on the results of the SVD analysis, similarities in the pattern of fault structure with the geological map are revealed, particularly in the northwest-southeast and southwest-northeast directions. The 3D model shows the density distribution of the Bonjol geothermal area ranging from 1.8 to 3 gr/cm3, with the interpreted heat source under Takis and Limau hot springs with a 2.8 gr/cm3. The clay cap is located at depths from 0 to 800 meters which is considered an altered Maninjau Pyroclastic Flow (Qapm). The reservoir is interpeted to correspond to either lava rock or sedimentary rock of the Sihapas Formation, which has undergone tectonic deformation.
References
Baroek, M, P., Heidrick, T, L., & Kelsch, K, D, 1999, Linked Tectonics, A Powerful New Paradigm For Deciphering The Structural Evolution Of The Menggala North Oil Field, SPE Asia Pacific Oil And Gas Conference And Exhibition.
Blakely, R, J., 1995, Potential Theory In Gravity And Magnetic Applications 1 Ed: Cambridge University Press.
Camacho, M., & Alvarez, R., 2021, Geophysical Modeling with Satellite Gravity Data: Eigen-6C4 vs, GGM Plus, Engineering, 1312, 690–706, https://doi.org/10.4236/eng.2021.1312050.
Chapin, D. A., 1996, The Theory Of The Bouguer Gravity Anomaly: A Tutorial, The Leading Edge, 155. 361–363. https://doi.org/10.1190/1.1437341.
Dentith, M. C., & Mudge, S. T., 2014, Geophysics For The Mineral Exploration Geoscientist : Cambridge University Press.
Elkins, T. A., 1951, The Second Derivative Method Of Gravity Interpretation: Geophysics, no. 161, p. 29–50.
Grandis, H., 2009, Pengantar Pemodelan Inversi Geofisika: HAGI.
Hackney, R. I., & Featherstone, W.E., 2003, Geodetic Versus Geophysical Perspectives Of The ‘Gravity Anomaly’: Geophysical Journal International, no. 1541, p. 35–43, https://doi.org/10.1046/J.1365-246X.2003.01941.X.
Hadi Pamungkas. S., 2017, Sistem Panas Bumi dan Usulan Wilayah Kerja Pertambangan Panas Bumi Lapangan Bonjol, Sumatera Barat, Institut Teknologi Bandung.
Henderson, R. G., & Zietz, I., 1949, The Computation Of Second Vertical Derivatives Of Geomagnetic Fields: Geophysics, 144, 508–516, https://doi.org/10.1190/1.1437558.
Hinze, W. J., Von Frese, R. R. B., & Saad. A. H, 2013, Gravity And Magnetic Exploration: Principles, Practices, And Applications: Cambridge University Press, https://doi.org/10.1017/CBO9780511843129.
Hirt, C., 2012, Efficient And Accurate High-Degree Spherical Harmonic Synthesis Of Gravity Field Functionals At The Earth’s Surface Using The Gradient Approach: Journal Of Geodesy, no. 869, p. 729–744.
Hutapea, F., Soemintadiredja, P., & Permana, A., 2010, Geothermal Eksploration Using Geochemical Method In Bonjol Area, Pasaman Regency, West Sumatera.
Indriana, R. D., Brotopuspito, K. S., Setiawan, A., & Sunantyo, T. A., 2018, A Comparison Of Gravity Filtering Methods Using Wavelet Transformation And Moving Average A Study Case Of Pre And Post Eruption Of Merapi In 2010 Yogyakarta, Indonesia: IOSR Journal Of Applied Geology And Geophysics.
Joni, W., & Hermawan, D., 2020, Bonjol Geothermal Structure Based On 2D Inversion Of Magnetotelluric Data: IOP Conference Series: Earth And Environmental Science.
Kusnadi, D., & Risdianto, D., 2007, Geologi Dan Geokimia Daerah Panas Bumi Bonjol Kabupaten Pasaman, Sumatera Barat.
Mustang, A., Dendi S, & Timoer S., 2007, Penyelidikan Gaya Berat Dan Geomagnet Di Daerah Panas Bumi Bonjol, Kabupaten Pasaman Provinsi Sumatera Barat, Bandung: Pusat Sumber Daya Geologi.
Naufal, M. A., & Rosid, M. S., 2020, Structure identification of geothermal field “X” using ML-SVD method of gravity data: IOP Conference Series: Materials Science and Engineering.
Nur Aziz, K., 2018, Identifikasi Struktur Bawah Permukaan Di Lapangan Panasbumi Lamongan Berdasarkan Analisis Data Gravitasi Ggmplus, Universitas Gadjah Mada,
Saptadji, N.M., 2001, Teknik Panas Bumi, Bandung: Penerbit ITB,
Sarkowi, M., & Wibowo, R.C., 2021, Geothermal Reservoir Identification Based On Gravity Data Analysis In Rajabasa Area-Lampung: RISET Geologi Dan Pertambangan, no. 312, p. 77–97.
Sarkowi, M., & Wibowo, R. C., 2021, Reservoir Identification Of Bac-Man Geothermal Field Based On Gravity Anomaly Analysis And Modeling: Journal Of Applied Science And Engineering, no. 252, p. 329–338.
Savero Helen, A., Joni, W., Febrianto Pandu Wibowo, P., & Wahyu Pratama, A., 2019, Bonjol Geothermal Tentative Model By Using 3G Geology,Geochemistry, And Geophysics Analysis: Prosiding Seminar Nasional Kebumian Ke-12,
Segawa, J., 1984, ‘Gravity Disturbance’ and the Structure of the Earth Substratum: Zisin Journal of the Seismological Society of Japan, no. 374, p. 621–632.
Sugianto, A., Suhanto, E., Widodo, S., Munandar, A., & Risdianto, D., 2015, Resistivity Structures Of Bonjol Geothermal Prospect, Indonesia, Derived From Magnetotelluric Data: Proceedings World Geothermal Congress, Melbourne, Australia.
Sumintadireja, P., Dahrin, D., & Grandis, H., 2018, A Note On The Use Of The Second Vertical Derivative SVD Of Gravity Data With Reference To Indonesian Cases.
Suprianto, A., Supriyadi, Priyantari, N., & Cahyono, B. E., 2021, Correlation Between Ggmplus, Topex And BGI Gravity Data In Volcanic Areas Of Java Island: Journal Of Physics: Conference Series.
Verduzco, B., Fairhead, J, D., Green, C. M., & MacKenzie, C., 2004, New Insights Into Magnetic Derivatives For Structural Mapping: The Leading Edge, no. 232, p. 116–119,
Wahyudi, E. J., Kynantoro, Y., & Alawiyah, S., 2017, Second Vertical Derivative Using 3-D Gravity Data For Fault Structure Interpretation: Journal Of Physics: Conference Series.
Author Bios

Laila Esa Muharani,S.T was born in Lampung, Indonesia. She holds a Bachelors of Engineering from the Sumatra Institute of Technology. She is currently a teaching assistant of a fieldwork course for gravity methods. She has taught gravity data processing and demonstrated data acquisition using the Scintrex CG-6 Autograv to more than 70 students. Laila.118120008@student.itera.ac.id

Dr. Ir. Muh. Sarkowi, M.Si, IPU is a Lecturer at Lampung University. He holds a Bachelor of Science degree from Diponegoro University, a Master of Science from Gadjah Mada University, and a Doctorate from the Bandung Institute of Technology. He is a licensed Geophysicist in Indonesia and has worked on many projects and research, especially in the fields of Gravity and Magnetic methods, and 4D Microgravity. He is the author of the book entitled “Pengantar Teknik Geofisika” and “Eksplorasi Gaya Berat,” published by Graha Ilmu. muhsarkowi@gmail.com

Selvi Misnia Irawati, S.Si., M.T. is a Lecturer at the Sumatra Institute of Technology. She holds a Bachelor of Science degree from Gajah Mada University and a Master of Engineering at the Bandung Institute of Technology. She is the head of the expert group in the field of natural resources at the department of Geophysics Engineering of Sumatra Institute Of Technology exploration specializing in Electromagnetic and gravitational methods. selvi.irawati@tg.itera.ac.id
