
By Doug Crice
You’ve been doing it wrong.
You’ve been trying to sell MASW to geotechnical engineers for 30 years. Telling them about how it can provide cross-sectional images of Vs structure for use in planning drilling programs. How it can help them avoid surprises, and failures, and lawsuits. The academics are believers. Geophysics, especially MASW, is an important part of their conferences—just consider these reprints from GeoCongress 2022, but what about the day-to-day engineers doing foundation investigations? Why aren’t they on the MASW bandwagon? Consider this quote from Bill Kwasny, P.E., D.GE, ASCE Life Member
“Whether you and I like it or not, the majority of geotechnical engineers in the USA live and die by the ‘blow counts’. Because drilling and sampling by the split-barrel is the fastest and cheapest way to do exploration. And the uninformed clients don’t know any better, so they accept it! Even in Chicago, where STS had established the lead in Geotech, where everybody got Shelby tube samples for water content, Qp, and dry density, most firms now just go with hollow stem augers and blow counts. We have to live with that.”
Practicing Geotechnical Engineers doing foundation investigations think in blow counts, not shear-wave velocities. They’ve been doing standard penetration tests their whole career. They use N values every day in the field and are comfortable thinking of them in terms of soil properties. I tried to come up with a good analogy to illustrate the point, but the best I could do is temperature. If you tell me it’s going to be 90 degrees Fahrenheit today, I know it’s going to be warm, but if you say 30 degrees Centigrade, I don’t automatically know what to wear to the field. Those of you in the metric world will have to create your own analogy.
The procedures are outlined in ASTM D1586, the Standard Test Method for Standard Penetration Test (SPT) and Split-Barrel Sampling of Soils.
This test method describes the procedure, generally known as the Standard Penetration Test (SPT), for driving a split-barrel sampler with a 140 lb [63.5 kg] hammer dropped 30 in. [750 mm] to obtain a soil sample for identification purposes, and measure the resistance of the soil to penetration of the standard 2 in. [50 mm] diameter sampler. The SPT “N” value is the number of hammer blows required to drive the sampler over the depth interval of 0.5 to 1.5 ft [0.15 to 0.45 m] of a 1.5 ft [0.45 m] drive interval.
If the engineer sees an N-value of 100 blows/foot, he knows he is working on a firm foundation and his structure isn’t likely to have problems. On the other hand, if the blow count is 5, he may be building his house on sand—Mathew 7:26.
So, how do we get from shear wave velocities to N-values for the benefit of the engineers? OYO Corporation in Japan collected a large number of empirical comparisons between shear wave velocities and N value. The results are shown in the following plot1
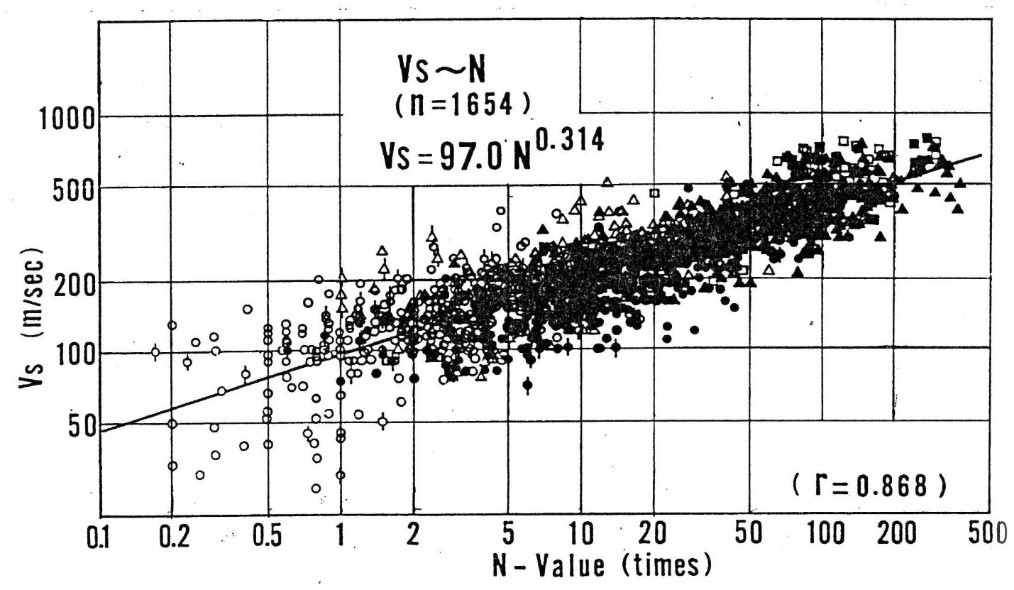
There is a lot of scatter, especially if you consider that this is a log-log graph. Some of the scatter will be in Vs, but as much or more is in the blow counts. Consider this quote from NHI Course No. 132031, Subsurface Investigations, — Geotechnical Site Characterization Reference Manual 522
In current U.S. practice, three types of drop hammers (donut, safety, and automatic) and four types of drill rods (N, NW, A, and AW) are used in the conduct of the SPT. The test in fact is highly-dependent upon the equipment used and operator performing the test. Most important factor is the energy efficiency of the system. The theoretical energy of a free-fall system with the specified mass and drop height is 48 kg-m (350 ft-lb), but the actual energy is less due to frictional losses and eccentric loading. A rotating cathead and rope system is commonly used and their efficiency depends on numerous factors well-discussed in the open literature (e.g., Skempton, 1986), including: type of hammer, number of rope turns, conditions of the sheaves and rotating cathead (e.g., lubricated, rusted, bent, new, old), age of the rope, actual drop height, vertical plumbness, weather and moisture conditions (e.g., wet, dry, freezing), and other variables.
Reportedly, this substantially understates the problem. The equation can be used to convert shear wave velocities into blow counts, and a plot of N-values can be substituted for the usual Vs sections. The result is a graphic display that talks to engineers clearly.
Let’s look at an example. This section is from a site with a school that has settling problems: doors that jam, windows that shatter, floors that tilt. The kids can’t even play marbles inside in bad weather.
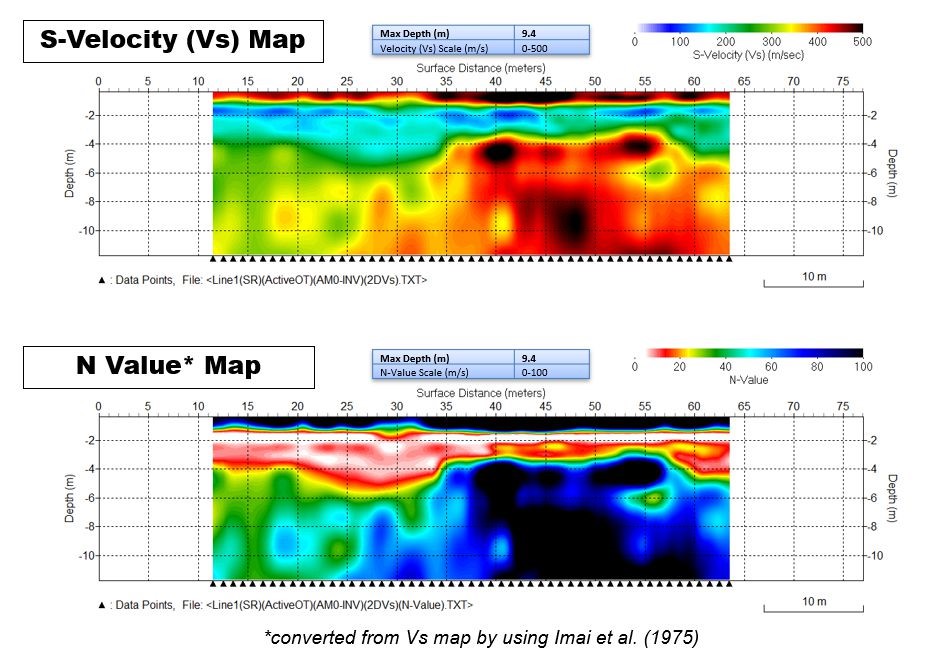
Clearly both plots contain the same information, but show the bottom figure to a Geotechnical Engineer and he can instantly interpret the geologic structure; bedrock on the bottom right and something really soft on the top left where the structure is failing. Show him the usual MASW plot and he/she has to do some serious thinking to understand the picture. In this case, the high N-value on the surface is the concrete floor and compacted fill. The low count below it is uncompacted fill. This is how you show a geotechnical engineer the value of MASW.
How do you get N-value plots? At least two of the vendors of MASW software are including the capability of plotting blow counts as an option, sometimes reluctantly, and typically discounting the significance. Here’s a quote from Choon Park of Park Seismic:
“Subject: Re: N-values and shear wave velocities”
“Calculating the N values from the MASW shear-wave velocities (Vs) is just like going backward in science. It is just like making a B&W photo from the color photo. However, I included this option in the newer version of ParkSEIS because it seems that the N-value sometimes talks better to engineers.”
It does talk better to engineers. The figures in this article were created with Park’s beta version. The formal release will be available in early 2023.
The Kansas Geological Survey (KGS) version, the SurfSeis software, has been offering an equation from Anbazhagan and Sitharam, 20083 , since early 2016 with similar constants. Julian Ivanov of KGS: “We’ve been providing the tool for remapping Vs into N-value plots for some years, now, trying to be sensitive to the needs of engineers and other near-surface experts solving real-world problems.”
At press time, KGS had been neglecting to mention this capability in the SurfSeis brochure. They fixed that, but it illustrates how they discounted the significance of a major feature they went to some effort to program into the software.
References describe the empirical equation in the general form:
Vs = ANB
Where Vs = the shear wave velocity and N equals the number of blow counts. A and B are constants that vary slightly depending on which reference is used. Notice that the equation is backwards for our purposes, used here to try and predict Vs from N Values. Shear-wave velocities are needed to predict earthquake site response. There is a scarcity of shear wave velocity measurements in most areas, but an abundance of boreholes with standard penetration test data. The N-values are used to estimate the shear wave velocities over a broad area for microzonation, extrapolated from the limited number of sites with shear-wave velocity information.
For our purposes, we would like to invert the calculation to get blow counts from Vs. I prefer the OYO equation because it is newer and was constructed from more data points:
Vs = 97N0.314
If you want to convert Vs into N, you need to solve for N. Sixty years ago, I could do the math, but I had to ask my high-school teacher granddaughter to do it for me. Here’s her solution:
N = (Vs/97)1/0.314 or N = (Vs/97)3.18
What is the point of this discussion? As geophysicists, you may be called on to present talks on MASW or do presentations for potential clients to an audience of Geotechnical engineers. You might write articles for Civil Engineering magazines with case histories. If you want to sell geophysics, give the customers information they can relate to. Present your results in a format understandable to the audience. That means blow counts—blow them away with results they will understand. If you have both engineers and geophysicists in the audience, you can show slides with both sets of data.
Incidentally, when you put together your PowerPoint, start with some results. Show them what you can do for them. After you pique their interest with some slides showing N-value cross sections and discussion of what the plots mean, which of course they will already have figured out, because they live and breathe blow counts, then you can bore them with discussions of wavelength vs. depth and dispersion curves.

(1) OYO Corporation is the major geotechnical firm in Japan. They have a long history conducting high-quality geotechnical services, even building special instrumentation for logging downhole shear wave velocities. They published excellent technical reports on the science including Technical Note TN-52 Measurement of S wave Velocity of the Ground and Application of S wave Velocity Data for Civil Engineering.” November 1984 which includes this plot. The report includes several other interesting applications of shear wave velocities for soil properties including shear strength and Q. A copy of the report is posted on the Geostuff web site at www.geostuff.com/OYO TN-52.pdf.
(2) This is a pretty comprehensive manual on geotechnical site investigations. Available for free download, it’s a good reference to familiarize oneself with all aspects of subsurface investigation from an engineer’s perspective.
(3) Anbazhagan, P., and T. G. Sitharam, 2008, Mapping of Average Shear Wave Velocity for Bangalore Region: A Case Study: Journal of Environmental and Engineering Geophysics, 13, 69-84, https://doi.org/doi:10.2113/JEEG13.2.69
(4) T. Imai, K. Tonouchi, Correlation of N-value with S-wave velocity and shear modulus, Proceedings ofthe 2nd European Symposium of Penetration Testing, Amsterdam (1982) 57–72.
Appendix
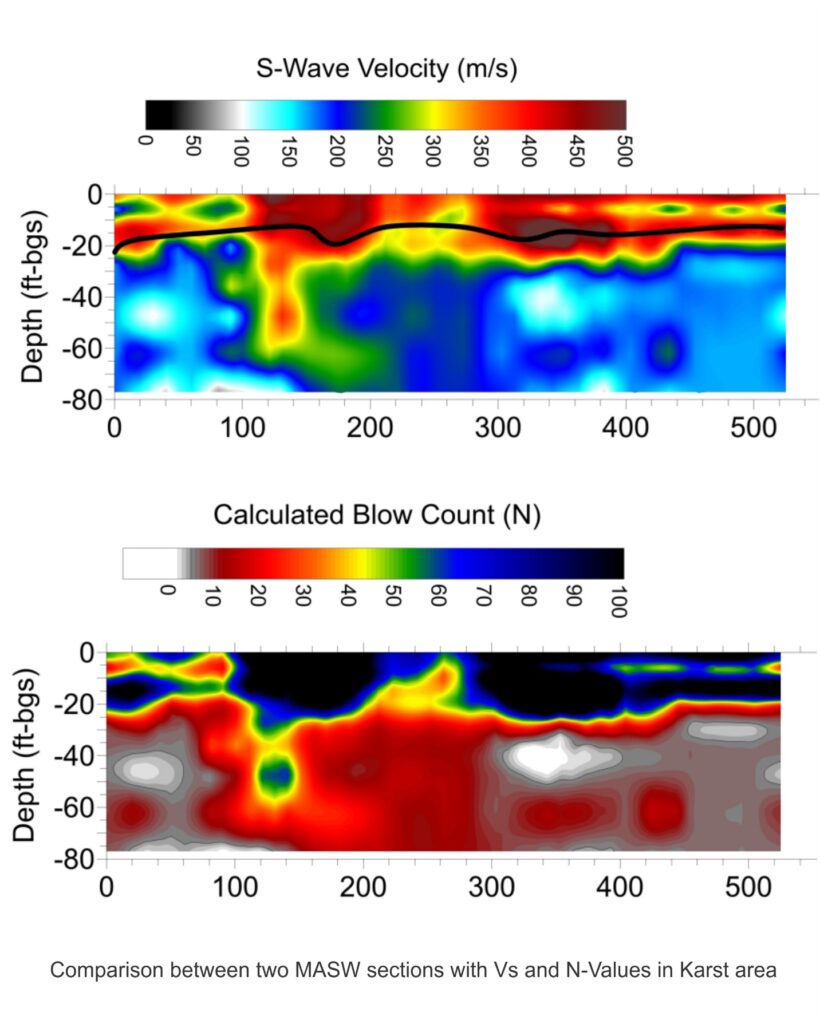
As an addendum, I am including a couple more comparative sections showing both shear wave velocities and N-values. The first is from an area with a serious Karst problem. A large structure with heavy tanks is planned. This work is almost unique in that the MASW survey was done before any drilling, probably because it is a known Karst area. Several lines indicate near-surface cavities. If the investigation had started with the usual, under-funded drilling program, they may or may not have encountered the areas with questionable foundation support. Now the client is planning to drill on the apparent voids rather than at random and will really understand the site problems (and probably choose another site for the factory). Of course, both plots show the cavities, but when the engineer sees a plot with a blow count of zero, that really alerts him/her to potential problems.
The second set of sections is from an area where a pipe rack failed because of foundation problems. As usual, everything you need to know is in the Vs section, and everything a geotechnical engineer wants to know is in the N-value plot. The proposed drilling program (once at each end and once in the middle) would have only encountered bedrock. This section was confirmed by SPT’s over the fracture zone and the bedrock.
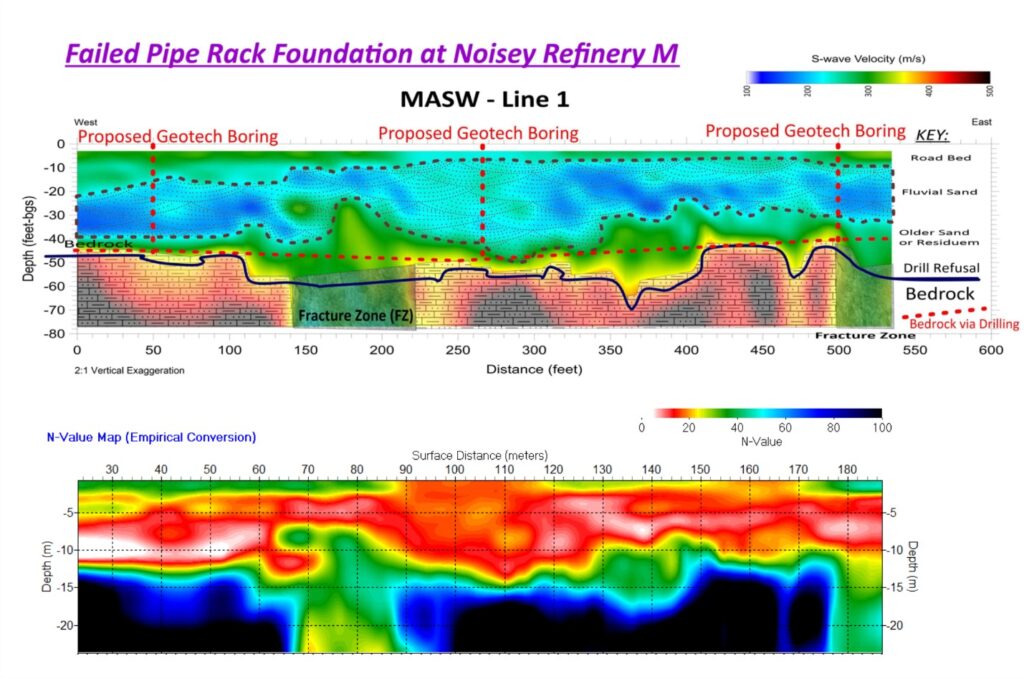
These images are courtesy of Brian Herridge of 3D Geophysics, a person worthy of a separate article just about him!
Addendum
Since posting the article, I have become aware of a newer manual on Subsurface Investigation for Geotechnical work. It is posted here https://nap.nationalacademies.org/catalog/25379/manual-on-subsurface-investigations and available for a free download. In addition to the usual material on field and laboratory soil testing, the section on geophysics, including MASW, is greatly expanded. The OYO Vs/N chart from this article is posted in color as Figure 9-27. The manual is a terrific reference and introduction to the geotechnical engineering world. Thanks to Dr Paul Mayne for the reference.
