
By Tristan Campbell1 and Dr Peter Fearns1
1Curtin University, Western Australia
Abstract
Honeybees are recognised as highly valuable for crop pollination around the globe, and high quality nutrition is required for the colonies to maintain strong populations for optimum pollination. Marri trees in southwest Australia produce pollen of excellent nutrition to honeybees, and the honey produced from nectar from these trees often contains high antimicrobial properties. With these trees occurring over a geographic range of over 84,000 km2, apiarists in southwest Australia often drive thousands of kilometers over the Marri flowering period to inspect flowering phenology and manage their beehives.
Previous work by the authors has included development of algorithms to measure changes in flower abundance from both satellite and UAV mounted sensors. This study represents the first integrated assessment of the different calculated flower abundances across multiple apiary sites.
Satellite and UAV data were acquired from four apiary Marri sites from January to February 2019, as well as anecdotal information on intra-seasonal honey production from apiarists who accessed the sites. The 2019 season was a poor honey production season and, as a result, all remotely-sensed flower coverage metrics were operating close to or below their estimated limitations of sensitivity.
Flower coverage measures from the Sentinel-3 satellite and regular UAV surveys were consistent with reported variations in honey production over the study period, as well as with each other. This indicates good potential for future use of these measures for future production periods, even over poor seasons. However, both approaches require good to cloud-free weather to acquire data.
The MODIS satellite flower measure showed minimal variation over the season and is, therefore, not able to provide useful information for apiary management. This is inline with initial assessment by the authors previously, which indicated that MODIS flower coverage is likely to be useful only in good harvest years.
Introduction
Honeybees (Apis mellifera) are globally significant for crop pollination (Potts et al. 2016), and are widely considered the most economically valuable pollinator in this sector (Klein et al. 2017). For bees to pollinate effectively, strong, healthy colonies are required (Vaissière 1991), with good nutrition available to the colonies for optimum rearing of larvae into healthy adult bees (Haydak 1970; Sagili and Pankiw 2007).
In southwest Australia, one of the key honey producing plants is the Marri tree (Corymbia calophylla). This species occurs over a range in excess of 84,000 km2 and generally flowers in late summer to early autumn (Herbarium 2015). Due to the geographic range, commercial apiarists commonly have multiple apiary sites for Marri honey production located hundreds of kilometers apart and drive thousands of kilometers each season to monitor the flower phenology of each site and manage their beehive movements accordingly.
In addition to potentially large honey harvest volumes from Marri forests of over 70 kg per hive over the 1 – 2 month flowering period (Campbell et al. 2020), honey from Marri trees often has exceptionally high antimicrobial properties (Irish et al. 2011) and the pollen from Marri trees is high in all nutrients required for rearing healthy bee larvae (Kratz et al. 2019).
While derivation of spectral indices for measuring changes in flower abundance from satellite-borne sensors have shown promise in mature Marri forests (Campbell and Fearns 2018a), results were not reliable over younger forests and mixed land-use apiaries using data from the MODerate Imaging Spetrometer (MODIS) (Campbell et al. 2019).
In this study, the Marri Flowering Index (MFI) derived by Campbell and Fearns (2018a) is calculated from Sentinel 3 and MODIS satellite data over multiple Marri apiaries during the 2019 Marri flowering season (January to February), with the relative flower abundance verified by regular UAV surveys of the apiary sites as specified by Campbell and Fearns (2018b)
Methods
Apiary site locations and honey harvest data
Data from four different apiary sites in southwest Australia were used for this study. As shown in Figure 1, three of these sites were in forests within 100 km of Perth, the capital city of Western Australia, and one site was near the south coast. These sites represent a range of different forest structures, as shown in Figure 2. These figures indicate the proportion of the vegetation canopy which is higher than 5 m, the height above which Marri trees are typically sufficiently mature to commence flowering (Brooker and Kleinig 2001).
The Northcliffe and Byford sites were both in mature forest, several kilometers from any extensive cleared farmland. The Northcliffe site has the tallest average canopy of any of the sites. The Hovea site was located in an area of forested private blocks of land (average size ~2 Ha) near John Forrest National Park and the Chidlow site is an area of Marri forest surrounded by farmland.
Honey harvest data was anecdotal information from the apiarists for each site. Overall, the 2019 season was a poor season, with no honey harvested from the Northcliffe and Byford sites. The Marri trees at the Northcliffe site formed buds over December and January, then the majority of the trees dropped the buds in early February, with almost no Marri flowers observed. Intermittent flowering was seen on some Marri trees at the Byford site over February but no beehives were placed at this location owing to the expected poor harvest. Therefore, no comments could be made regarding variability in honey production over the study period.
Less than 20 kg of Marri honey was harvested per hive for the Hovea and Chidlow sites. These two sites both recorded some production of Marri honey at the start and end of February, with a rain event in the middle of the month reducing production for approximately one week.
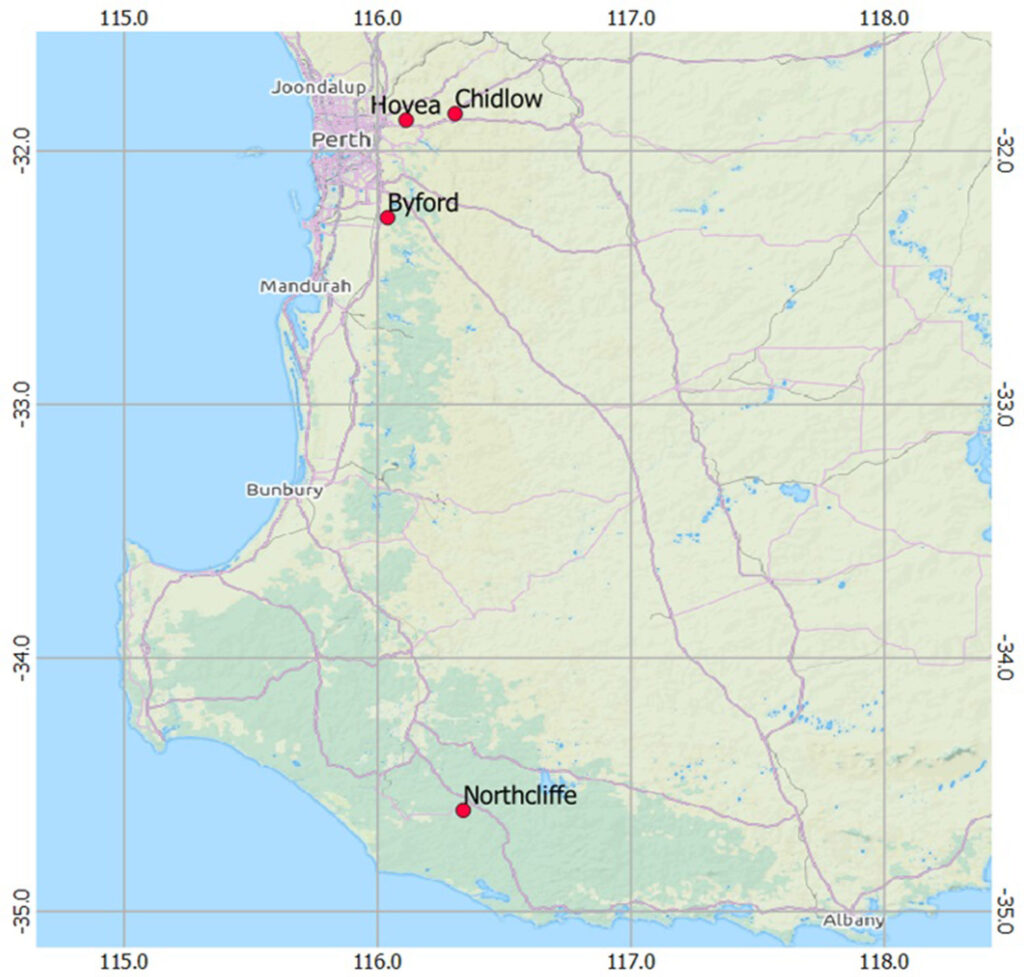
Figure 1 – Location of study apiary sites. Coordinates in WGS84
Satellite MFI calculation
Ground-based spectroradiometer data were used by Campbell and Fearns (2018a) to determine the spectral ranges with the highest spectral separation between Marri flowers and surrounding material in these forests (Campbell 2019). It was determined the Marri flowers have a higher spectral reflectance in the visual range (450 – 650 nm) and a lower spectral reflectance in the UV range (< 450 nm). Therefore, the greatest spectral separation for satellite data is achieved by dividing the highest visual band reflectance (~550 nm) by the UV band reflectance, where these bands are available. This number is designated as the Marri Flowering Index (MFI). This hypothesis was tested using over 10 years of honey harvest data from an apiary site near Perth in mature Marri forest and the years with exceptionally high harvest weights (> 40 kg of Marri honey per hive) were reliably distinguished from lower harvest years by the MFI derived from the MODIS sensors. However, later analysis of MFI and honey harvests of multiple apiary sites over 10 years showed that the MODIS-derived MFI is not reliable across all locations (Campbell et al. 2019).
Since this research was carried out, data from the European Space Agency’s (ESA) Sentinel-3 satellite has become more widely available. As the spectral analysis in Campbell and Fearns (2018a)) indicated that the MFI from the Sentinel-3 satellite is more sensitive to changes in flowering abundance than the MODIS sensor, and Sentinel-3 has a higher spatial resolution than MODIS, Sentinel-3 data were acquired over the 2019 Marri flowering period (mid-January to March).
Sentinel-3 data were obtained through the Copernicus Open Access Hub (https://scihub.copernicus.eu/), with the relevant Sentinel-3 scenes downloaded in the NetCDF4 format. Data were then processed in the Sentinel Application Platform (SNAP – https://step.esa.int/main/toolboxes/snap/) with scenes geolocated and all band and quality data extracted from the pixel coordinate for each study site.
The MFI was calculated for each study site for each cloud-free acquisition by dividing Band 6 by Band 1 (as per Campbell and Fearns (2018a) to create a dataset of relative flower coverage over time per study site. To allow comparison with the previously utilised MODIS-calculated MFI, MODIS MYDOCGA-006 data were downloaded for each study site over the same period and the MFI calculated from Band 10 divided by Band 8, with the data filtered by quality control flags contained within the file downloaded from Application for Extracting and Exploring Analysis Ready Samples (AppEEARS – https://lpdaacsvc.cr.usgs.gov/appeears/).
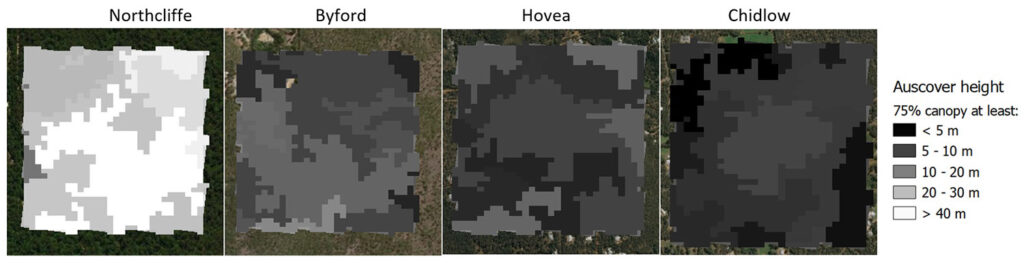
Figure 2 – Forest structure for each study site, derived from Auscover the Vegetation Height and Structure Dataset (Scarth 2009). Colour scale is height at which 75% of the plant cover has been intercepted. The Auscover data covers an area of 1 km x 1 km for each site.
UAV flower abundance calculation
UAV imagery were acquired using a DJI Mavic Pro UAV drone, with the UAV following pre-defined flight paths in the AutoPilot app for repeatable coverage between UAV surveys. Surveys were conducted on a weekly basis where weather and other logistical constraints permitted. Flight altitude was set to 60 m for all flights, as recommended by Campbell and Fearns (2018b), and the percentage of flower coverage calculated as per the parallelepiped method on the RGB image data as detailed in the same publication.
For each survey, the average percentage flower coverage was calculated for all UAV images to create a dataset of percentage flower coverage over time per study site. Examples of acquired UAV images and the resulting flower coverage classification are provided in Figure 3.

Figure 3 – Example of UAV images before and after flower coverage classification. Example has classified 1.5% of pixels as flower
Results
Sentinel-3 MFI
The Sentinel-3 MFI for each study site are presented in Figure 4, along with the MODIS MFI and UAV flower coverage. Despite an average revisit of time of less than 2 days for the study area, the average time between cloud-free acquisitions of Sentinel-3 data for each site ranged from 4 to 8 days (see Table 1), with a maximum data gap period of 26 days recorded for the Chidlow site. This trend of high cloud cover continued through March, with no cloud-free days occurring for any Sentinel-3 revisit days for the whole month.
| Study Site | Average Time | Maximum Time |
|---|---|---|
| Northcliffe | 4.0 days | 12 days |
| Byford | 6.0 days | 16 days |
| Hovea | 6.0 days | 20 days |
| Chidlow | 8.0 days | 26 days |
Of the four study sites, three showed an overall increase in MFI over the study period. As noted previously in the Methods section, the majority of the Marri trees at the Northcliffe site dropped their buds prior to flowering. This is consistent with the low Sentinel-3 MFI measure of ~0.9 that did not vary considerably.
The three study sites near Perth all showed similar patterns, where cloud-free days allowed for acquisition of sufficient quality Sentinel-3 data. The Sentinel-3 MFI for these three sites commenced at ~1.5 in the middle of January and reached a peak of 2.3 – 2.6 at the end of February. For Byford and Hovea sites, data from early February showed an increase in Sentinel-3 MFI to >2.0 before a temporary reduction in MFI in the middle of the month. This pattern in Sentinel-3 MFI is consistent with the reported honey production variability for the Perth region. Sentinel-3 data was unavailable for Chidlow in early February.

Figure 4 – Sentinel-3, MODIS and UAV flower coverage for each study site from 15/01/2019 to 28/02/2019. Note that the satellite-derived MFI is displayed against the left-hand vertical axis and the UAV flower coverage is displayed against the right-hand vertical axis. Blue points are Sentinel-3 MFI, grey points are MODIS MFI and orange points are UAV calculated flower coverage.
MODIS MFI
The MFI calculated from MODIS data for the same period showed little variation, with the MODIS MFI for all sites averaging ~1.5 and showing considerably less variation than the Sentinel-3 MFI over time. Certainly, there is no indication of the increase in MFI expected in February based on the reported honey production variation and the Sentinel-3 MFI patterns.
UAV flower coverage
All four study sites had a UAV flower coverage progression of lower coverage (<0.5%) in January and highest coverage at the end of February (1.8 – 4.5%). It is important to note that the UAV flower coverage algorithm is estimated to be more reliable for flower coverages greater than 2% (Campbell and Fearns 2018b) and therefore these low coverage estimates need to be used with caution.
The UAV flower coverage for all sites followed a similar pattern to the Sentinel-3 MFI for each site, with Northcliffe having consistently the lowest flower coverage and the Byford and Hovea sites increasing in early February with a mid-February decrease before increasing towards the end of the month and Chidlow showing a more stable increase from the end of January to late February.
Discussion and conclusions
Given the previously published sensitivity levels for the different methods used to measure Marri flower coverage in this study (1.1% for Sentinel-3, 2.1% for MODIS and 2% for UAV imagery), the three different datasets used in this study performed as expected given that the study year was of below average Marri honey harvests, with concomitant low levels of Marri flower coverage.
It is clear that the MODIS MFI does not have sufficient sensitivity for detecting changes in flower coverage during poor flowering years. This is in line with the previous research by Campbell and Fearns (2018a), in which MODIS MFI was able to distinguish between good and moderate to poor years but not moderate to poor years on a seasonal basis. The more detailed intra-seasonal data used in this study confirmed the inadequate performance of MODIS MFI in poor years, although ideally similar repeated studies in moderate and good years would be conducted to verify the findings across the range of harvest qualities.
Despite working at the lower limits of sensitivity, the Sentinel-3 MFI and UAV flower coverage both correlated with anecdotal information relating to intra-seasonal honey production, and each other. This promising result indicates the potential for apiarists to utilise the Sentinel-3 MFI data to infer honey production during the season without visiting apiaries for manual inspection of beehive condition. When apiaries are visited, UAV surveys can provide a more detailed measure of the flower phenology behaviour and further inform apiary management decisions.
Both the Sentinel-3 MFI and UAV flower coverage measurements suffer from weather constraints common in remote sensing; the Sentinel-3 MFI requires cloud-free days coincident with revisit times and UAV surveys require site visits as well as rain-free days (although surveys can still be conducted on cloudy days).
As with the MODIS MFI, further studies in moderate to good honey harvest seasons would assist with verification of the scope and accuracy of these metrics for apiary management. If beehives are present on the apiary sites, these studies may be combined with detailed hive data from beehive monitoring hardware, which have become more widely commercially available in recent years (e.g. www.arnia.co.uk). Detailed data on ambient temperature, hive activity and honey production (via changes in hive weight) will all assist with improved understanding between Marri flower ecology, remote sensing data and apiary management.
References
Brooker MIH, Kleinig DA (2001) Field guide to eucalypts. vol Volme 2, South-western and southern Australia. Bloomings Books, Melbourne, Australia
Campbell T (2019) Ground-based spectroradiometer measurements of vegetation and groundcover of Corymbia calophylla forests in Western Australia. Curtin University. doi:10.25917/5d47b72fc294f
Campbell T, Dixon K, Dods K, Fearns P, Handcock R (2020) Machine Learning Regression Model for Predicting Honey Harvests Agriculture 10:118
Campbell T, Fearns P (2018a) Honey crop estimation from space: Detection of large flowering events in Western Australian forests. Paper presented at the ISPRS TC I Mid-term Symposium “Innovative Sensing – From Sensors to Methods and Applications”, Karlsruhe, Germany,
Campbell T, Fearns P (2018b) Simple remote sensing detection of Corymbia calophylla flowers using common 3 –band imaging sensors. Remote Sensing Applications: Society and Environment 11:51-63 doi:10.1016/j.rsase.2018.04.009
Campbell T, Fearns P, Dods K, Dixon K (2019) Prediction and detection of honey harvests from remote sensing and weather data International Journal of Engineering Sciences & Research Technology 8:73 – 88
Haydak MH (1970) Honey Bee Nutrition Annual Review of Entomology 15:143-156 doi:10.1146/annurev.en.15.010170.001043
Herbarium WA (2015) Florabase. Department of Parks and Wildlife. https://florabase.dpaw.wa.gov.au/. Accessed 22 April 2015 2015
Irish J, Blair S, Carter D (2011) The Antibacterial Activity of Honey Derived from Australian Flora PLoS ONE 6 doi:10.1371/ journal.pone.0018229
Klein S, Cabirol A, Devaud J-M, Barron AB, Lihoreau M (2017) Why Bees Are So Vulnerable to Environmental Stressors Trends in Ecology & Evolution 32:268-278 doi: https://doi.org/10.1016/j.tree.2016.12.009
Kratz M et al. Essential amino acid composition of emerging bees fed different food sources. In: Bee Industry Council of Western Australia 2019 Industry Conference, Perth, Western Australia, 2019.
Potts SG et al. (2016) Assessment Report on Pollinators, Pollination and Food Production.
Sagili R, Pankiw T (2007) Effects of protein-constrained brood food on honey bee ( Apis mellifera L.) pollen foraging and colony growth Behavioral Ecology and Sociobiology 61:1471-1478 doi:10.1007/s00265-007-0379-1
Scarth P (2009) Vegetation height and structure – derived from ALOS-1 PALSAR, Landsat and ICESat/GLAS, Australia coverage. Brisbane, Australia. doi: http://dx.doi.org/10.4227/05/5703458340442
Vaissière BE Honey bee stocking rate, pollinator visitation, and pollination effectiveness in upland cotton grown for hybrid seed production. In: ISHS Acta Horticulturae 288: VI International Symposium on Pollination, Tilburg, Netherlands, 1991. International Society for Horticultural Science (ISHS), Leuven, Belgium, pp 359-363. doi:10.17660/ActaHortic.1991.288.58
Author Bios
Tristan Campbell is an experienced geoscientist, with over 20
years of experience in the application of geophysics and remote
sensing methods to engineering, environmental and agricultural
applications. His hobby of beekeeping has lead to research into
the use of these methods to improve honey production and bee
health. A complete list of his publications is available on Google
Scholar. tristan.campbell@curtin.edu.au

Peter Fearns has over 25 years experience in physics and
environmental remote sensing science. Fields of interest include
ocean colour remote sensing and in-water optical processes,
reef and coastal habitat mapping, bush fire detection, airborne
and drone vegetation mapping, and monitoring dredge activities. peter.fearns@curtin.edu.au
