
Barry Balding
This article presents several high-level case studies in which a variety of geophysical methods have played an important part in providing solutions to various different tailings design, construction and management issues. Case studies include the evaluation of palaeokarst features using Seismic Refraction, Micro-Gravity and ERI (Electrical Resistivity Imaging) methods; testing the integrity of dam walls using EM31, MASW (Multi-channel Analysis of Surface Waves) and ERI; the identification of zones of potentially trapped water in tailings using MASW; the identification of leaks in dam walls using ERI and IP; and the use of ERI in distinguishing variation in material type for the construction of embankments and associated earthworks.
Case Study 1: The Evaluation of Palaeokarst Features under a proposed Tailings Storage Facility (TSF) using Seismic Refraction, Micro-Gravity and ERI
Background
The site, located in Europe, is underlain by rocks ranging in age from Lower Palaeozoic siltstones, sandstones, shales and greywackes, through to Lower Carboniferous limestones, consisting of bioclastic calcarenites and pale micritic limestone units, which tend to be karstified. The aim of the investigation was to identify the extent of possible palaeokarst features below the proposed footprint of the TSF.
Methods and Findings
The target of the detailed ground investigation was the micritic limestone units. Quantifying the extent of the palaeokarst features would allow the geotechnical engineers to safely design the facility and provide for its integrity into the future. A Quaternary glacial till of ca. 3 to 6 m in thickness, consisting of grey silty clay to clayey silt with sand, gravel and some cobbles/boulders overlies the bedrock in the area. Seismic Refraction was used to provide information on the depth to,
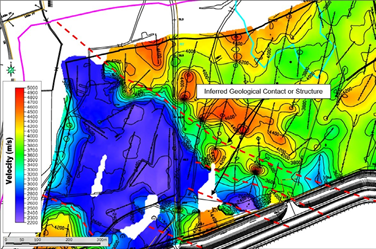
and quality of the bedrock across the site and also on the potential rippability of the material. The data were collected using a Geometrics Geode 24-channel seismograph with 4.5 Hz geophones spaced at 3 m intervals, providing a depth of investigation of between ca. 25 and 30 m below ground level (bgl). The data were processed using SeisOpt® Pro software.Figure 1 presents the interpreted bedrock velocity map for part of the site, showing the inferred contact between the Lower Palaeozoic siltstones/sandstones and Lower Carboniferous limestone lithologies. The lower velocities for the bedrock (ca. < 3,000 m/s, the area in blue in Figure 1) are indicative of the underlying Lower Carboniferous limestones, with the higher velocities (ca. > 3,000 m/s) reflecting the presence of the Lower Palaeozoic sediments.
A micro-gravity (10 m grid) survey was used to target the area of lower velocities identified from the seismic refraction as shown in Figure 1. The data were collected using two Scintrex CG5 gravity meters. Base station readings were measured at a minimum of every 2 hours so that the instrument and diurnal drift could be calculated and removed from the data. The stations were accurately surveyed using a Trimble R8s/TSC3 system. A minimum of three measurements were taken
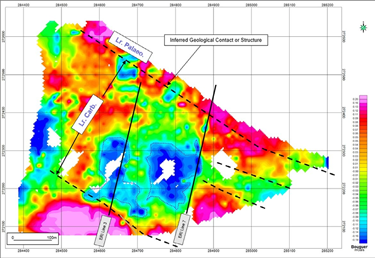
at each station to ensure repeatability. Drift corrected data were corrected for terrain, latitude, elevation and Bouguer (using a density of 2.67 g/cm3). Data were subsequently exported to Oasis Montaj where gridding, filtering and plotting routines were conducted. Figure 2 presents the Bouguer anomaly map for the site with geological features inferred from mapping on the ground.
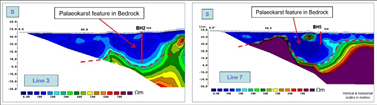
Two areas with low gravity results within the Lower Carboniferous limestone were targeted for follow-up with an ERI investigation (Lines 3 and 7). The orientation of the lines was chosen to be perpendicular to the known geological strike of the site, with the locations chosen to allow safe access and line continuity. A gradient array using a 5 m electrode spacing, over 400 m long lines was used to provide a depth of investigation of ca. 60 to 70 m bgl. An ABEM Lund Imaging System was used to collect the data and processing was undertaken using RES2DINV©.
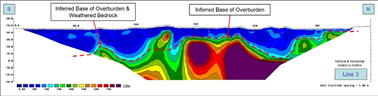
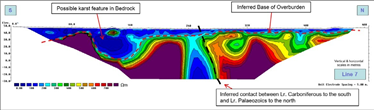
Figures 3 and 4 present pseudosections of the processed apparent resistivity (in ohm metres (Ωm)) for Lines 3 and 7 with topography included.
Subsequent drilling of BH2 on Line 3, and BH5 on Line 7 confirmed the presence of palaeokarst features below the base of the overburden, to depths of at least 40.3 m and 19.5 m respectively (Figure 5). BH2 encountered sands, silts, clays, and gravels/cobbles, while BH5 encountered sands, silts and clays. Both boreholes were terminated as the drill rods became stuck prior to reaching their target depths.
The outcome of the geophysical investigations and follow-up intrusive investigations indicated that the ‘karst’ features identified underlying the proposed TSF area consisted of a palaeokarst system, with karst features infilled (‘choked’) with post-glacial infill materials, including sand, silt, clay and rock fragments.
Case Study 2: Testing the Integrity of TSF Impoundment Dam Walls using EM31, MASW and ERI
Background
Golder was retained to undertake geophysical investigations to ascertain the structural integrity of a number of tailings dam walls, and to provide information on the variation in the ‘make-up’ of construction materials (and method of construction) used in the dam walls in central Asia.
Methods and Findings
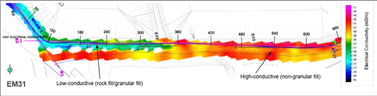
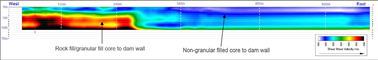
A combination of EM31, MASW and ERI methods was used to identify the extent of rockfill in the construction of a recently constructed dam wall. The EM31 survey was undertaken using a Geonics EM31-MK2 Ground Conductivity Meter, providing a measurement of subsurface conductivity to a maximum depth of ca. 6 m bgl (dependent on the resistivity of the ground at the time of surveying). Data were collected continuously along lines approximately 10 m apart, over a 50 m wide stretch of ground along the centre-line of the dam wall. As an overview method, the EM31 picked out variations in embankment material type, delineating areas of rock fill and non-granular fill (clay rich) material (Figure 6). The MASW method was used to help evaluate the elastic condition (stiffness) of the materials used in the construction of the dam wall. MASW was used to analyse the propagation velocities of surface waves to evaluate the shear-wave velocity distribution and arrangement of subsurface materials. MASW was carried out at 6 m intervals using a Geometrics Geode 24-channel seismograph, over all accessible sections of the embankment that the EM31 was carried out over, providing information on the upper ca. 10 m of the embankment. Figure 7 presents the MASW results as a long section along the length of the same dam wall as shown in Figure 6. Velocities above ca. 300 m/s (coloured yellow to black) are interpreted to be associated with the presence of a granular/rock fill material as the main construction material for the core of the dam wall between chainages 0 m and ca. 260 m. Velocity values of < 200 m/s (coloured blue) are interpreted to be associated
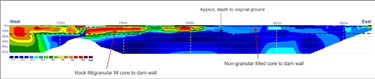
with the presence of a non-granular/clay material as the main construction material for the core of the dam wall between chainages ca. 260 m and 660 m. An ABEM Lund Imaging System using a gradient array with a 3 m electrode spacing was used to collect resistivity data and provide a depth of investigation of ca. 40 to 50 m bgl. Resistivity values along the same length of the dam correlate well with the results of the EM31 and, to a lesser extent, with the MASW results. Low resistivity values of < 40 Ωm signify the presence of a non-granular/clay material as the main construction material for the core of the dam wall, between chainages ca. 350 m and 660 m (Figure 8). Follow-up intrusive investigations confirmed the findings of the geophysical surveys and indicated that the dam was only partially constructed with granular/rock fill. The construction of a rock buttress was subsequently recommended to strengthen the dam wall.
Case Study 3: Testing the Integrity of TSF Impoundment Dam Walls using ERI
Background
Golder was retained to undertake an ERI survey to ascertain the structural integrity of a tailings dam wall placed across a valley in central Asia.
Method and Findings
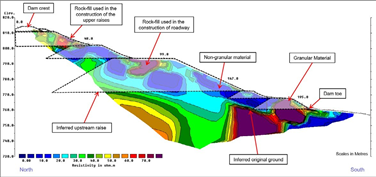
An ABEM Lund Imaging System was used to collect the data with a gradient array electrode spacing of 5 m. Topographical data were collected using a Trimble R8s/TSC3 system. Following acquisition, the recorded data were pre-processed to remove noisy data by de-spiking before inversion processing using RES2DINV©, which provided a contoured pseudosection of apparent resistivity. Figure 9 presents the processed data as a pseudosection for one of the ERI lines which was surveyed from the toe to the crest of the dam wall. Upstream raises were inferred from the topography as no as-built records were available. Very low resistivity results (ca. < 20 Ωm) infer that much of the dam wall is composed primarily of non-granular materials, with the exception of granular rock-fill used in the construction of the toe of the dam, a roadway built about halfway up the dam, and the recent construction of the upper raises of the structure. Following the findings of the ERI survey a rock buttress was designed to provide long-term stability to the lower parts of the dam wall.
Case Study 4: Identifying Trapped Water in Tailings using MASW
Background
Water levels in monitoring wells associated with a tailings dam wall in Central Asia were starting to reach critical levels. As a result, closely spaced pressure relief wells were designed to be drilled into the upstream crest of the dam to alleviate potential water pressure. To specifically target the trapped water in the tailings behind the dam wall, and to speed up the drilling process, a MASW survey was commissioned.
Method and Findings
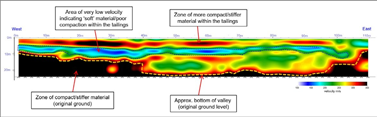
MASW was identified as an appropriate method based on the premise that the results of the MASW would allow the evaluation of shear-wave velocity distribution (i.e. stiffness) in the tailings, and therefore allow identification of accumulations of potentially trapped water (i.e. areas of less stiffness compared to the surrounding tailings). The survey was conducted using a Geode digital seismograph, with a 24-channel streamer, 4.5Hz vertical geophones, and a hammer energy source with mounted trigger. Geophone spacing was 1.80 m. Processing was carried out using the SURFSEIS processing package developed by Kansas Geological Survey (KGS, 2000).Figure 10 presents processed MASW data from a line that was surveyed across the slope of the dam, about halfway between the crest and the toe. The results indicate a zone of sub-horizontal, poorly compacted material underlying a more compact/stiffer material at depths of up to 10 m bgl along much of the line, with the lowest velocities around chainage 30 m. This zone around chainage 30 m was identified as an area which may contain more water than the surrounding tailings.
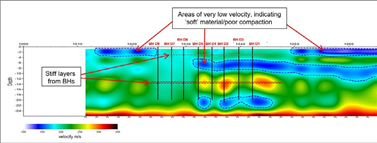
A second line was surveyed across the crest of the dam (Figure 11) and shows a similar pattern to Figure 10. In this case, three zones of potentially poorly compacted material (i.e. less stiff, water saturated tailings) were identified from close to surface to ca. 20 m bgl within the tailings. Drilling of tightly spaced boreholes confirmed the presence of sub-horizontal, poorly compacted material, both close to surface and at depth (in blue); reflecting that these zones of low velocity contained more water than the surrounding tailings. The results of the MASW survey were successfully used to target closely spaced pressure relief wells into the upstream crest of the dam to alleviate potential water pressure from building up behind the dam wall.
Case Study 5: Identification of Leaks in TSF Impoundment Dam Walls using ERI and IP
Background
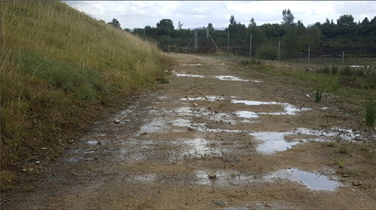
During a routine inspection of a recently capped TSF, water was noticed seeping from the toe of the facility (Figure 12). An ERI survey was commissioned along with other geophysical and intrusive investigations to investigate the nature and source of the seepage water.
Methods and Findings
An ABEM Lund Imaging System using a gradient array with a 1.5 m electrode spacing was used to collect data along a number of closely spaced lines parallel to the crest of the dam wall both inside and outside of the liner. The ABEM system used allowed for the collection of both resistivity and induced polarization (IP) data. The IP method was used to help map the potential pathway(s) and/or indicate the location(s) of potential leakage points, as ionized water can appear chargeable under certain conditions. A Tigre system using a Wenner array with a 3 m electrode spacing was also used to collect data. Following acquisition, the recorded data were pre-processed to remove noisy data by de-spiking before inversion processing using RES2DINV©, which provided a contoured pseudosection of apparent resistivity. The corresponding resistivity and IP pseudosections for a line surveyed along the slope of the dam wall parallel to the crest is shown in Figure 13. The IP pseudosection identifies two possible target areas for follow-up intrusive investigations, at ca. 140 m and 160 m respectively.
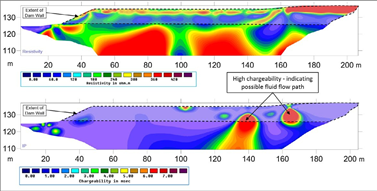
Extensive follow-up intrusive investigations uncovered a number of tears in the HDPE liner which were patched and made good.
The facility continues to be monitored on an ongoing basis as it passes into aftercare.
Case Study 6: The use of ERI in Distinguishing Variation in Material Type for the Construction of Embankments.
Background
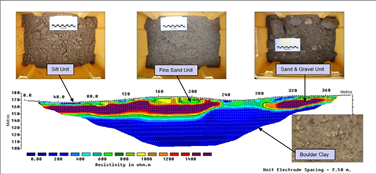
ERI is widely used to assist in determining variation in overburden material type, depth to bedrock, bedrock type and extent of weathering/alteration in bedrock. In this case, ERI was used to differentiate between sand and gravel units, and glacial ‘boulder clay’. The survey was also able to distinguish between variations within the sand and gravel units.
Methods and Findings
An ABEM Lund Imaging System was used to collect the data with a gradient array electrode spacing of 5 m. Topographical data were collected using a Trimble RTK system. Figure 14 presents a pseudosection for a line of resistivity contoured at three different fixed contour intervals; 25 Ωm, 50 Ωm and 100 Ωm. By comparing the contour intervals in Figure 14, a distinction in material types can be recognised along the line, from a ‘cleaner’ (less silty/clay rich material) coarser material with resistivities of > 1400 Ωm to a more ‘dirty’ (increased silty/clay rich material) finer material (with resistivities of < 200 Ωm
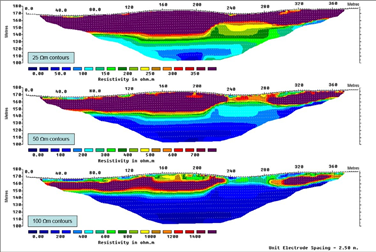
By calibrating the resistivity results with trial pit and borehole information, a robust 3D groundmodel for the site was developed, enabling quantities of different material types to be estimated for construction purposes.
Conclusions
In Case Study 1, the findings of the combined surveys (seismic refraction, micro-gravity and ERI) and targeted follow-up intrusive investigation provided the necessary reassurance to the regulator to grant the facility a construction and operation permit. The outcome of the combined surveys in Case Studies 2 (EM31, MASW and ERI) and 3 (ERI) indicated that the tailings dam walls that were investigated were only partially constructed with granular rock fill, providing the necessary basis of design for rock buttresses in both cases to prevent possible dam failure in the future. The use of MASW in Case Study 4 was successful in identifying areas for intrusive intervention to elevate potential water pressure from building up behind a dam wall.In Case Study 5, ERI & IP was used to successfully target and uncover a number of tears in the HDPE liner, thereby saving time and expense in costly intrusive investigations to the satisfaction of both the client and the regulator. The careful calibration of ERI data with targeted intrusive investigations in Case Study 6, provided the developer with information on variation in material type and associated quantities across the site for use in construction. The use of multi-method geophysical methods in conjunction with intrusive investigations can provide a key part in delivering solutions to a variety of different tailings design, construction and management issues. The combination of methods used in the case studies presented, provided targeted, time efficient and cost effective solutions.
Acknowledgements
The author would like to thank Apex Geophysics Ltd. (www.apexgeophysics.ie) for their assistance in conducting a number of the case studies presented above.
Author Bio

Barry Balding PGeo EurGeol
Golder Associates Ireland Limited Town Centre House, Dublin Road, Naas County Kildare, W91 TD0P
Ireland
Barry is a Senior Scientist with over 30 years technical and management experience in the mining and aggregate industries. He has been responsible for the management of large integrated mining projects (including Scoping, PFS and DFS), as well as site assessments (including resource evaluation) and project due diligence for a variety of commodities worldwide. Barry also has extensive project management experience in producing EIAs and Planning/Permit Applications for the Extractive Industry. His experience also covers the design, execution and management of geophysical surveys for hydrogeological, environmental, geotechnical, engineering and mineral investigations. He has extensive project management experience in the integration of geophysical, geological, geotechnical, groundwater and survey data into 3D ground models using a variety of software packages.His experience also covers the management, planning and execution of exploration programmes for base metals and gold, including the use of geophysics.He has managed specific geophysical investigations in a variety of countries, including Ireland, UK, Sweden, Finland, France, Armenia, Kazakhstan, Kyrgyzstan, Oman, Morocco, Sierra Leone, Guinea, Guinea Bissau and Canada.Barry holds a BA (Hons) degree in geology from Trinity College, Dublin and an MSc degree in Applied Geophysics from University College Galway. He is a Professional Member (PGeo) and founding member of the IGI (Institute of Geologists of Ireland), a member of the European Federation of Geologists (EurGeol) and a member of the Irish Association for Economic Geology (IAEG). Barry is a past member of the Board of the IGI.
