
By Esther Babcock 1
1 Logic Geophysics & Analytics LLC;
Email: [email protected]
Published 09/22/2021
Abstract
Climate change can exacerbate erosion in coastal environments. Where cemeteries are impacted, grave locations need to be accurately determined for mitigation efforts. Ground-penetrating radar (GPR) provides one tool for non-invasively locating marked and unmarked graves. Here, we use GPR at a cemetery in coastal Alaska, to provide georeferenced maps of grave locations in support of efforts to relocate the adjacent church and preserve the site against coastal erosion.
Introduction
The effects of climate change manifest themselves in a myriad of ways, not just the typically envisioned warming and corresponding sea-level rise (Nerem and others, 2018). In Alaska, these effects include diminished winter sea ice extent; increased winter temperatures; accelerated rates of permafrost degradation; and heightened erosion (Melvin and others, 2017). Coastal erosion has become a significant problem for Alaskan communities, where infrastructure built near the ocean or riverbanks becomes at risk for loss (Melvin and others, 2017).
Many Alaskan communities are built on shorelines due to the traditional cultural activities including water-borne food gathering such as fishing and whaling. Accelerated erosional events may require entire such villages to relocate inland to higher ground or places assumed to be less prone to erosional events (Jones and others, 2009). Communal buildings such as tribal council offices, schools, and churches are among the threatened infrastructure that is displaced during such a move.
Although the relocation efforts of course include public and private buildings as well as personal possessions, the subsurface components of such a relocation are not often as readily envisioned. Cemeteries are one such aspect. Relocating graves is a complicated, culturally sensitive, endeavor for these Alaskan communities. However, before graves can be relocated, they must be located. Geophysical methods provide a tool for locating graves in locations impacted by climate change, whether to move the graves or for other reasons as is the case for our study presented here.
Geophysical methods such as ground-penetrating-radar are uniquely suited for grave detection and mapping as they are non-invasive to these vulnerable areas (Dick and others, 2017). Ground-penetrating radar (GPR) in particular has seen widespread use and recent press in cemetery mapping and forensic investigations. A wide body of previous research and industry work has demonstrated the applicability of GPR for this task (Urban and others, 2012; Witten and others, 2001; Bradford, 2018). Strengths of the GPR method for locating graves include its ability to detect graves with minimal surface disturbance; its ease of employment in typical cemetery conditions; and the fact that modern GPR software packages allows rapid post-processing and visualization of the collected data for interpretation. Weaknesses of this method include the potential for both false positive and false negative results due to the often-disregarded limitations of the method; potential for inexperienced users to choose less-than optimal acquisition parameters such as frequency or survey-line spacing; and physical limitations of the method such as inability to image through conductive materials (i.e. clay). Nonetheless, GPR remains the best-available non-destructive technology for grave mapping. In this work, we used GPR to map graves at a cemetery located on Kodiak Island, Alaska (Figure 1) in the community of Karluk, whose church must be relocated due to coastal erosion.
Ground-penetrating radar
Ground-penetrating radar uses electromagnetic (EM) energy traveling as waves to gain information about subsurface conditions or object locations (Annan, 2005). The GPR transmitter emits EM energy with a known central frequency, which propagates outwards and downwards. The energy is then sampled by a corresponding GPR receiver, which records the measurements for later processing and interpretation.
Where the propagating energy encounters a change in electrical properties, namely electrical conductivity and permittivity, some of the down-going energy is transmitted and some reflected to the measuring receiver (Jol, 2009). The following equation gives the reflection coefficient R, relative to the transmitted energy, at normal incidence:
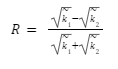
where k is the complex-valued wavenumber which is a function of frequency, conductivity, and magnetic susceptibility, and the subscript denotes the material above and below our presumed boundary. Commonly, practitioners neglect the frequency-dependent nature of this variable within the GPR frequency range. If we also assume that conductivity and the magnetic susceptibilities are negligible, we can derive a simplified expression for R:
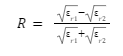
where E (unitless) represents the relative electrical permittivity of the material.
Starting by introducing the full reflectivity equation, with the wavenumbers rather than the permittivity, serves as a reminder that GPR techniques as commonly implemented for subsurface mapping assume many conditions that may not, in fact, reflect reality. For example, a cemetery could potentially have clay-type soils where conductivity will prevent reliable grave detection. Assessing each site’s conditions and suitability for the method is an essential part of the geophysical process.
Assessing GPR suitability also requires assessing suitability of the targets. As Equation 2 shows, the magnitude of a reflection event depends on the electrical properties of the materials involved (see Table 1). For the case of burial detection, the relative permittivity of soil can range from 3 to 40 depending on soil type, water content, mineralogy, pore size, and water ion content, to name a few. Similarly, the relevant electrical properties of the burials themselves can be inconsistent. For one thing, the conditions of burials especially in older cemeteries is likely to depend on age. Bodies may be interred in coffins, or simply boxes, or by themselves. For the case of a body interred in a coffin, the coffin is air-filled. Air is the material with the most contrast relative to the surrounding soil (Table 1). Therefore, we may expect a detectable reflection event from an air-filled coffin, all other conditions being amenable. For an older burial suspected to be interred natively, the low contrast for bone permittivity relative to the surrounding soil may make detection difficult or impossible. Additionally, a body alone provides a smaller target than a body in a coffin.
| Material | r | Conductivity (mS/m) | Velocity (m/ns) |
| Air | 1 | 0 | 0.3 |
| Water | 80 | .5 | 0.033 |
| Dry sand | 3-5 | .01 | 0.13 – 0.17 |
| Wet sand | 20-30 | 1-10 | 0.06 |
| Silts | 5-30 | 1-100* | 0.05 – 0.13 |
| Clays | 5-40 | 2-1000* | NA (no penetration) |
| Dry Bone | 3-5 | 0.02 | 0.13 – 0.17 |
Table 1. Electrical properties relevant to the cemetery investigation (Annan, 2005; Schneider and others, 2018).
Another factor influencing successful GPR detection of graves is choice of frequency. Commonly-available commercial GPR hardware comes in a range of central frequencies, from ~2 GigaHertz (GHz) to as low as 8 MegaHertz (MHz). Frequency is inversely related to wavelength, that is, as frequency increases wavelength shrinks (assuming the same material properties). Therefore, higher frequencies have better resolution than lower frequencies since lateral resolution Δl is a function of wavelength (Jol, 2009):
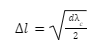
where d is depth to the target, and λc the center frequency wavelength. The corresponding limitation is that higher frequencies attenuate more rapidly than lower frequencies, decreasing the depth of penetration of the EM wave. Further, increasing conductivity also results in signal attenuation.
Thus, choice of frequency for GPR surveys is a trade-off between resolution and depth. In the case of cemeteries, most burials likely occur within 1-2 meters (m) of the surface. Typically, frequencies in the range of 250-500 MHz can provide imaging to that required depth, depending on all the myriad soil properties already discussed. Previous testing has shown that GPR frequencies in the range of 400-500 MHz provide optimal results for graveyard mapping. For example, when testing different frequencies at the same site, a 450-MHz central-frequency system had a ~90% success rate compared to only a 10% success rate with a 225-MHz antenna (Dick and others, 2017). The 400-500 MHz range appears to provide sufficient resolution for the relatively small targets that burials provide while still providing enough signal penetration to reach them.
Field Site
The community of Karluk, Alaska, is located on the west side of Kodiak Island, about 500 kilometers southwest of Anchorage, Alaska (Figure 1). Karluk currently has approximately 30 full-time residents. The village is not connected by road to any other settlement; access is obtained via the village’s gravel airstrip or from the sea. The two project personnel and the equipment flew by charter aircraft from Kodiak to Karluk and back in one day in April 2021, being on the ground for survey activities for approximately 10 hours. These logistics minimized interaction with the villagers and eliminated the need to stay overnight in the village due to concerns around transmission of the Covid-19 virus.
Kodiak’s climate is mild by Alaskan standards, with highs in the summer around 15° C and lows in the winter down to ~-5° C. Annual rainfall is ~2 m. According to the United States Department of Agriculture, soils on Kodiak are deep, well-drained soils formed in sequences of volcanic ash overlying glacial till. (A 1912-eruption of a nearby volcano, the 5th largest eruption in recorded history, laid the ash deposits.) The typical soil classification is a silt loam. This material likely has amenable properties for GPR signal penetration, having lower conductivity than clay-type soils.
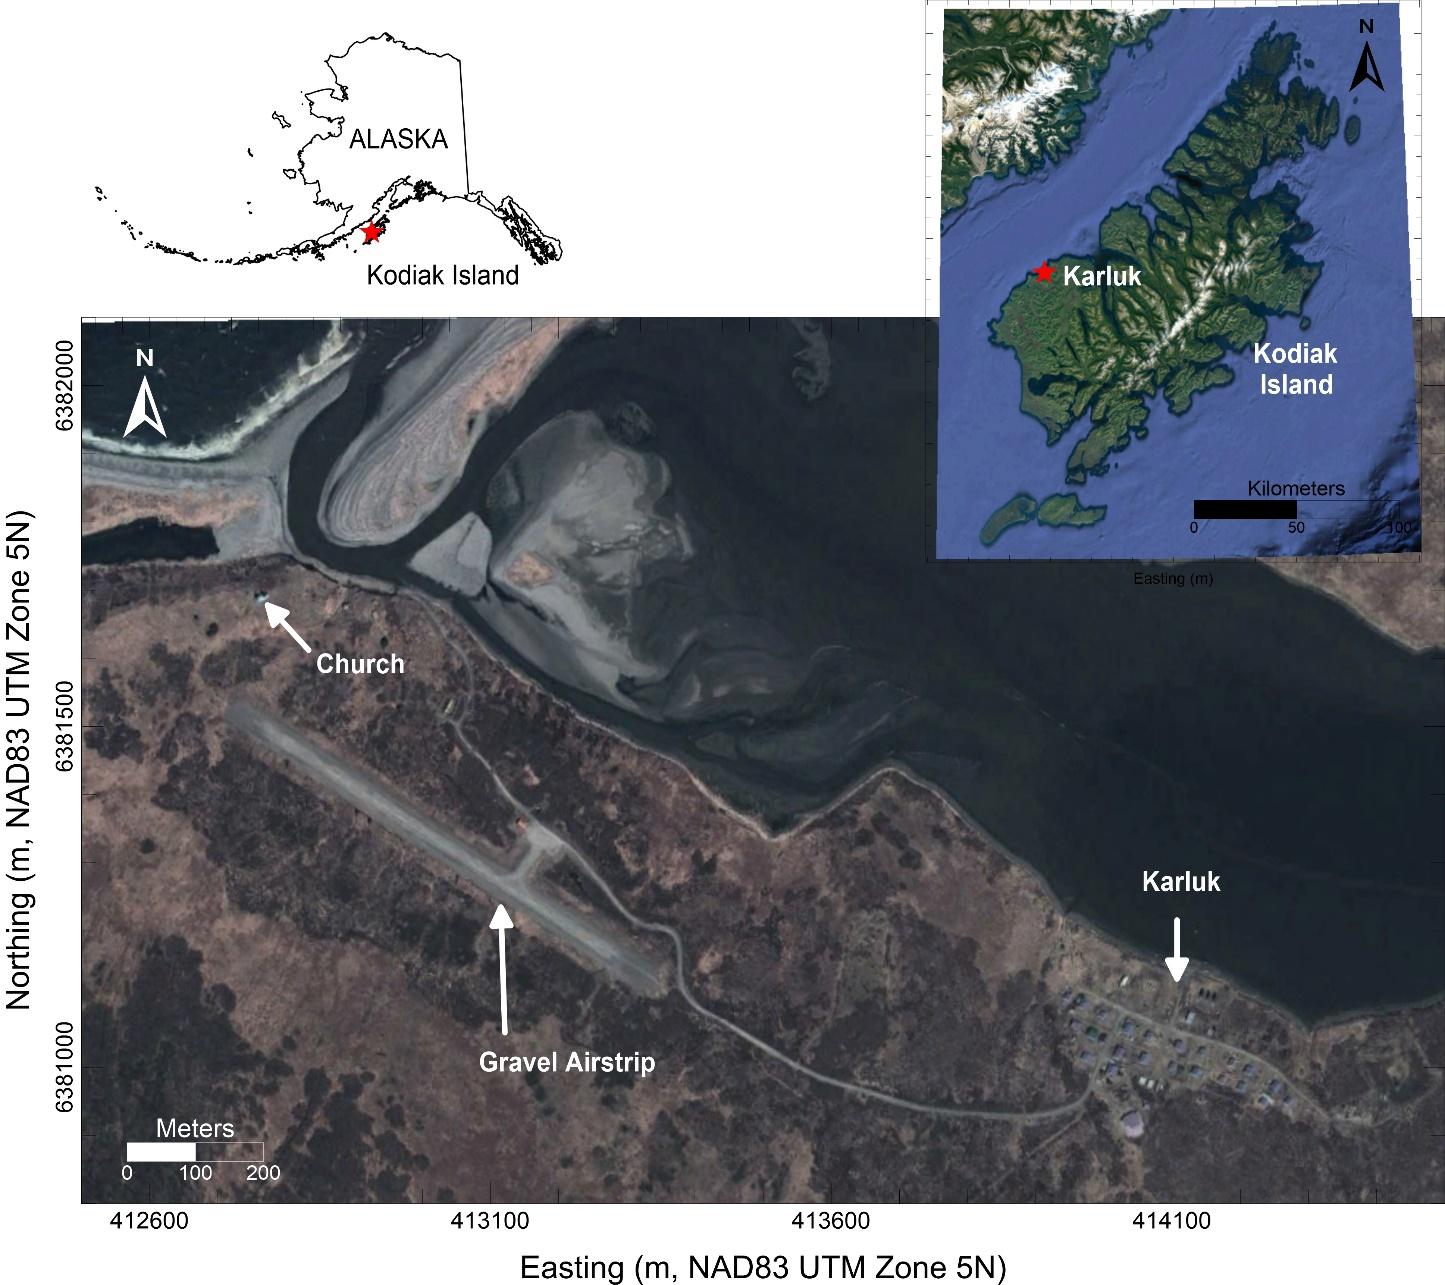
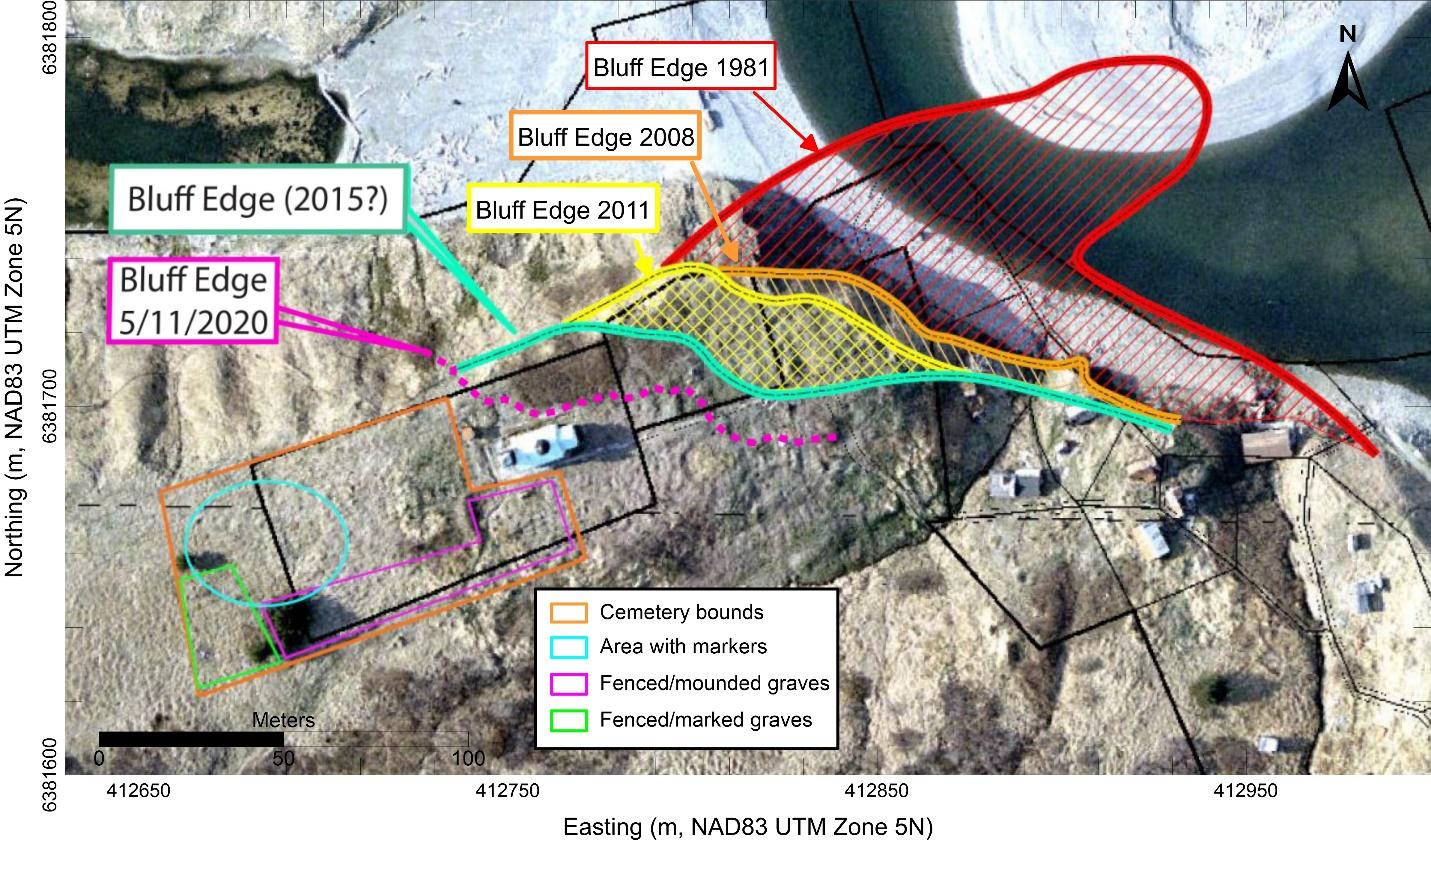
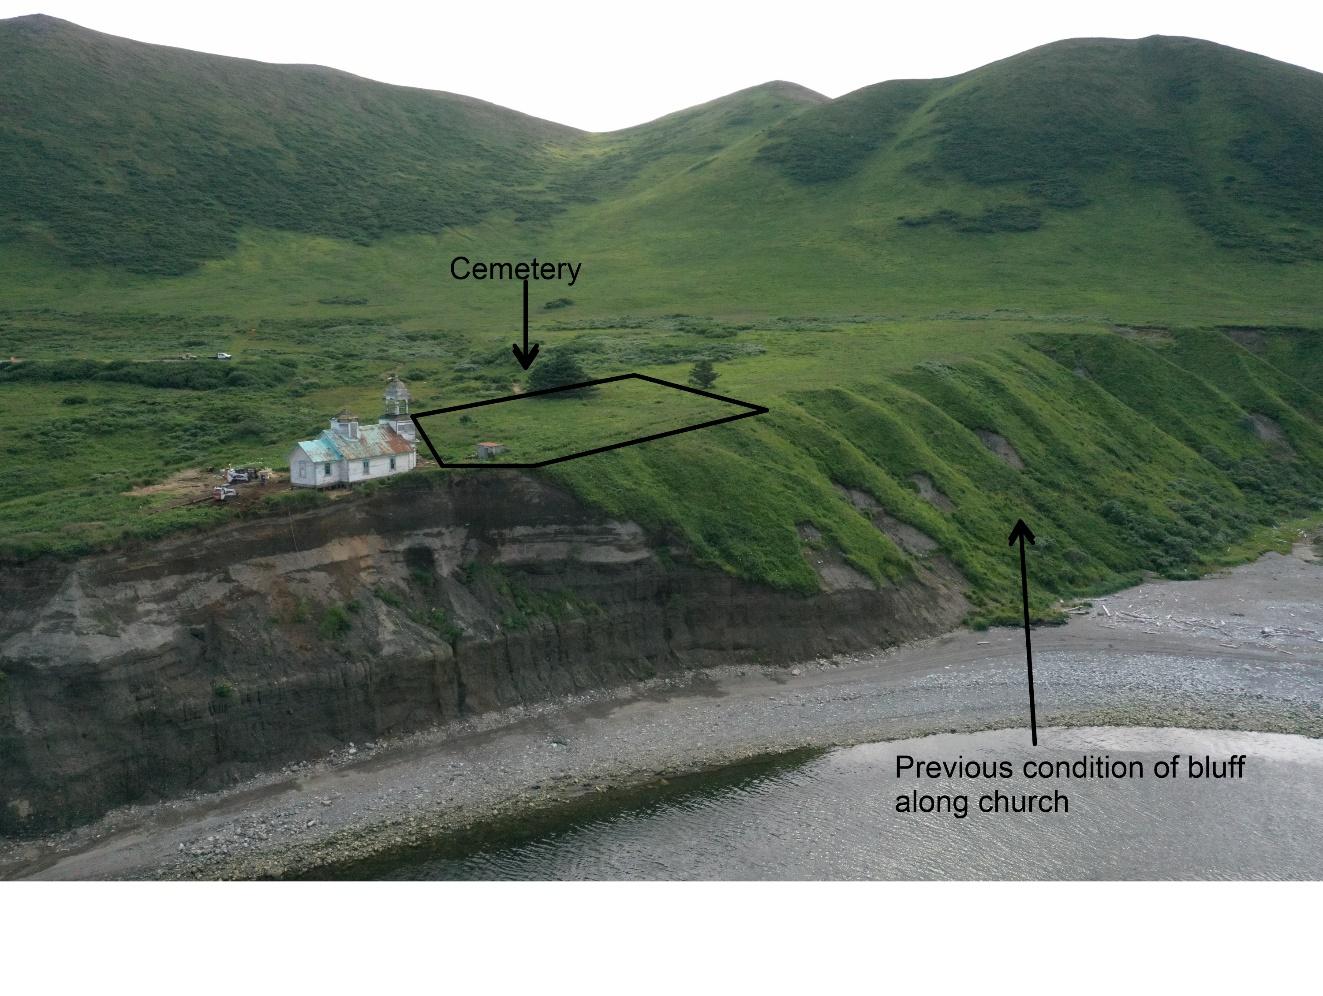
The church is located northwest of the village overlooking the ocean and the mouth of the Karluk River a short distance from the end of the airstrip (Figure 1). The cemetery is west and southwest of the church (Figure 2). Local knowledge indicates the presence of hundreds of burial areas dating back to 1888. Evidence of burials on the surface include raised mounds roughly 2 m long and 0.5 m high; headstones; fenced-off burials areas; depressions of similar size to the mounds mentioned above; and small artifacts other than headstones that appear to be marking graves. Surface-expression of the graves, where visible, indicated a predominant orientation along an axis roughly parallel to the long axis of the church. The cemetery surface was covered mostly by grasses, with some undulations and small-scale variability in topography. The surface was dry throughout the data collection.
Project Background
In the 18th century, Russian fur traders established settlements on Kodiak Island as they expanded their fur trading outposts eastward across native coastal Alaskan communities. Religion spread along with the fur trade. As a result, Russian Orthodox churches are found in many Alaskan communities that had contact with the Russians centuries ago, along with a sustained practice of the religion itself (Naske and Slotnick, 2011).
The Russian Orthodox church at Karluk is unique as one of the longest continually used Russian Orthodox churches in Alaska, since its construction in 1888 (Steffian and others, 2015). (In fact, this GPR survey occurred during the Russian Easter, which was celebrated in the church by members of the Karluk community.) It is listed on the National Register of Historic Places. When the church was built, the shoreline was far from the church and down a gradual grassy slope – similar to the terrain seen on the northwest side of the church currently (Figure 3) – rather than a steep bluff. The eroding bluff has been a concern for the community since 1978 (Steffian and others, 2015). In the last 5 years, erosion of the bluff has accelerated significantly. After the winter of 2020-2021, the edge of the eroding surface was within 3 m of the structure (Figure 3).
Leaders of the village and members of ROSSIA (Russian Orthodox Sacred Sites in Alaska) were alarmed at the continued erosion and its acceleration. Obviously, the church was threatened and susceptible to destruction as the erosion continued. The decision was made to preserve the church by moving the structure away from the bluff. ROSSIA planned an initial, emergency, move to the west, providing interim separation from the bluff while deciding upon a permanent safe location for the historic structure.
Moving the church to the west to a temporary safe location would necessarily involve encroachment onto the cemetery. Knowing the precise burial locations within the cemetery would allow the moving crews to protect the graves during the church movement and its temporary placement within the cemetery boundaries. After considering the available options, the ROSSIA personnel chose to use GPR to map the burial locations and inform the church move.
Equipment and Survey Design
We used the Sensors & Software “pulse EKKO Pro” GPR imaging system with a central frequency of 500-MHz for this project. Settings were generally in accordance with manufacturer guidelines, with a trace-to-trace separation of 0.03 m as measured by an attached odometer wheel. A Global Navigation Satellite System (GNSS) antenna was mounted above the center of the GPR equipment, providing differentially corrected GNSS information from all 5 global satellite networks. General accuracy was 10-20 centimeters while receiving 30-40 satellites simultaneously. The GNSS equipment streamed data into the GPR controller during acquisition for seamless real-world positioning of results. GNSS-data transmission rate was 1-Hz.
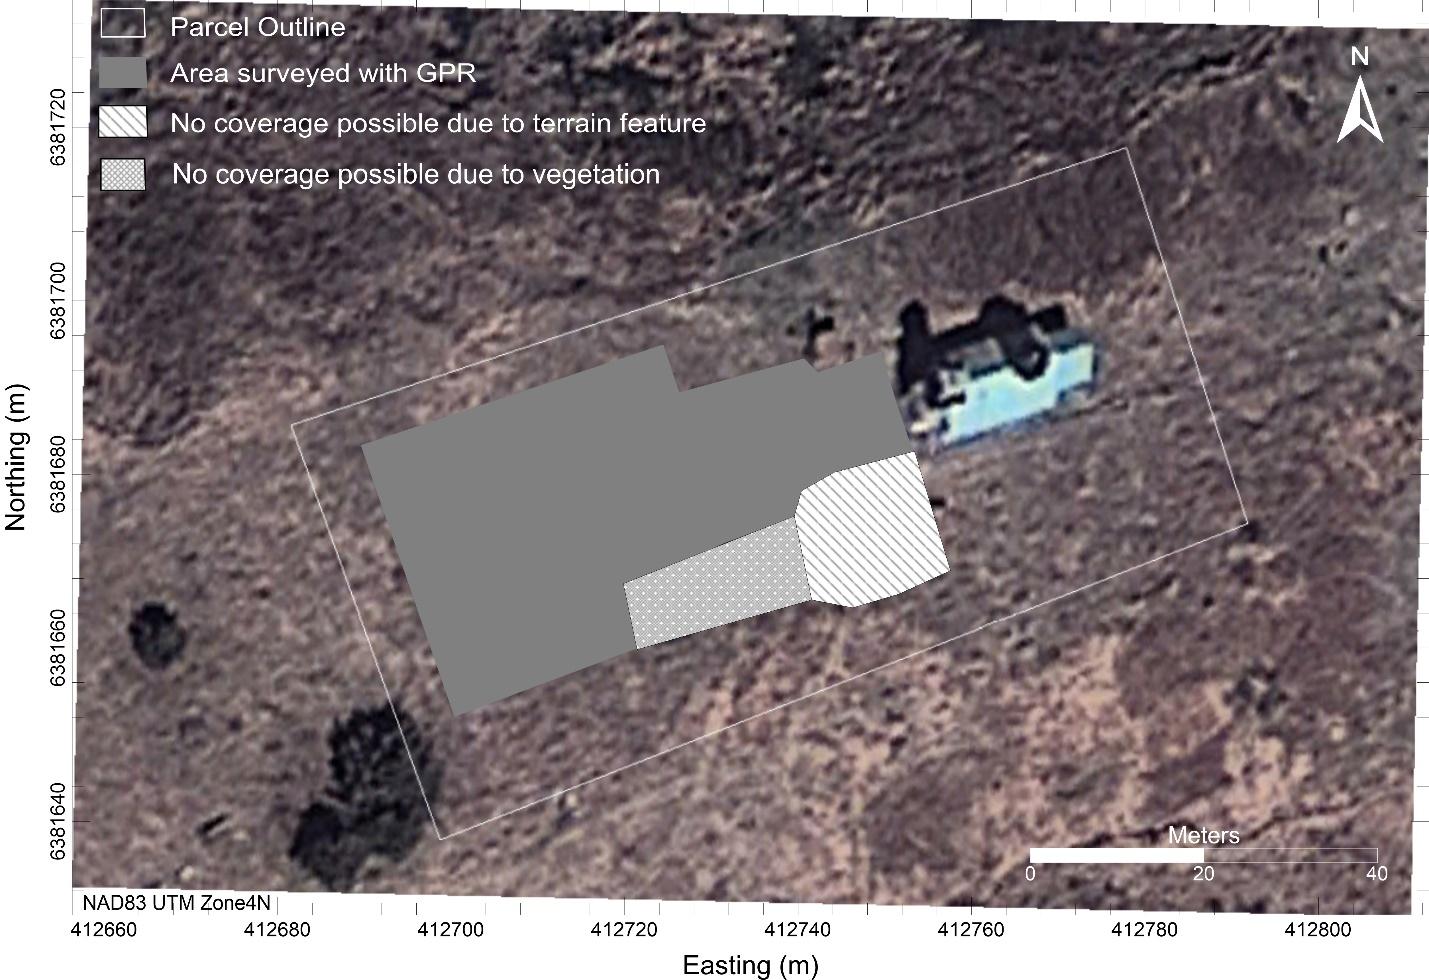
Within the survey boundaries, project personnel set up 2 separate grids due to variable surface conditions, covering approximately 1,400 square meters (m2) total (Figure 4). In the area closest to the church, the lines were oriented approximately parallel to the church. This orientation was not optimal given the suspected orientation of the majority of graves along the same axis. However, localized topography dictated the line direction in that section of the cemetery. Further from the church, the site was flatter; and lines were oriented roughly perpendicularly to the long axis of the church. This line orientation should intersect the graves so as to cross the grave, rather than run along the grave. This preferred line direction provides 2 advantages: 1) more lines are likely to cross any given burial location since the grave is wider than it is long; and 2) the grave will tend to generate a more typical (and therefore more interpretable) GPR hyperbolic response when crossed at this orientation.
Line spacing for this survey was ~0.25 m but was variable due to the surface conditions. Tighter line spacing, 0.1 m, is optimal when implement this antenna configuration and frequency for cemetery mapping. However, due to limitations of time and the rough nature of the site surface, tighter spacing was not deemed viable or useful. With 0.25-m line spacing and lines oriented perpendicularly to the graves, we estimated ~6 lines would cross a given burial. Having multiple lines cross the anomaly is optimal for visualization and essential for producing map-view information for subsequent interpretation. There is a tradeoff between line spacing, time, and also cost. Proper survey design and line spacing should trump cost if at all possible, especially when investigating such a sensitive area where false negatives can be emotionally devastating to the community. A line spacing greater than 0.25 m would have produced unreliable results for this site.
Data Processing and Interpretation
All data processing occurred in the manufacturer’s software, “EkkoProjects” version 6. Initial processing steps included quality control review of the GNSS and GPR data. The GPR data were qualitatively high quality, with low signal-to-noise ratio. The GNSS data required minor editing likely due to movement of the GNSS antenna as the system moved across the rough surface. Subsequent GPR-data processing was comprised of a time-zero correction; bandpass filtering to remove the low-frequency energy and other random frequency noise; and a full-length background subtraction filter to remove the direct arrival event.
For visualizing the data in map view, an envelope function and migration filter were applied to the data which were then gridded together to form a pseudo-3D cube of data. Amplitudes were output in 0.05-m-thick slices from the surface downwards for visualization, with a spherical and exponential gain correction applied. Amplitude values represent the average reflection signal strength within the depth-slice window. I tested the migration algorithm with a range of reasonable velocities for damp silty soils, from 0.06 m ns-1 to 0.1 m ns-1. The final velocity for processing the data set was 0.08 m ns-1, which corresponds to a soil relative permittivity of ~14.
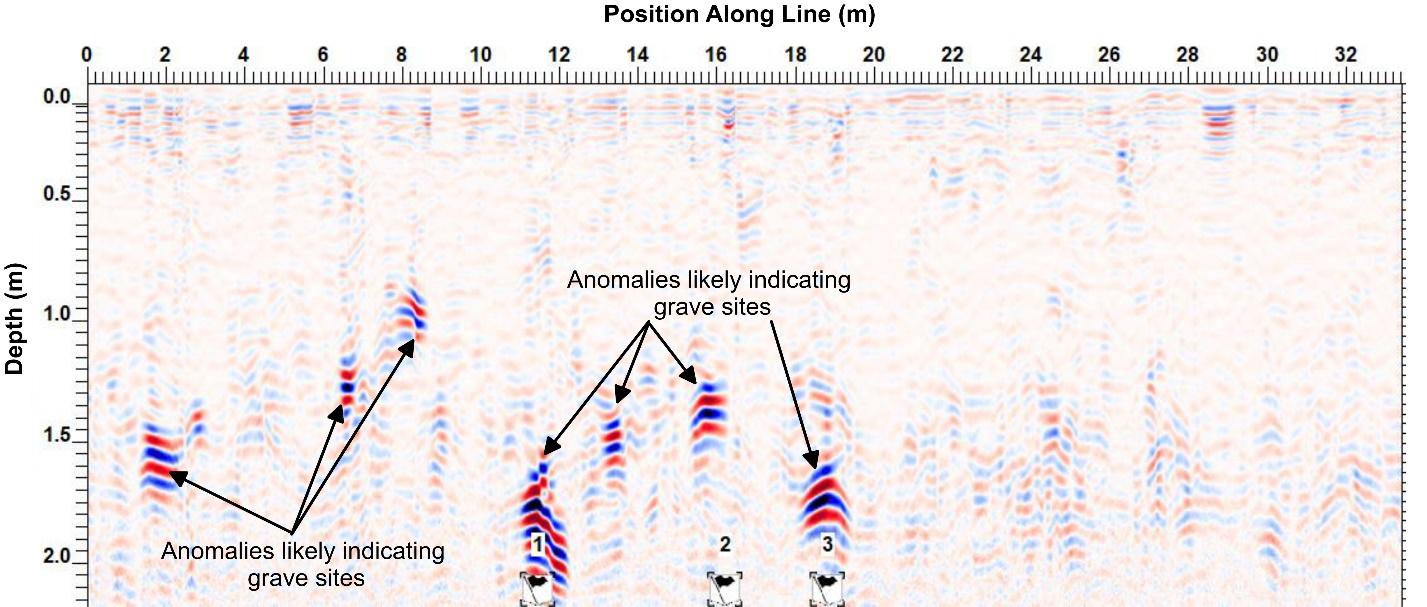
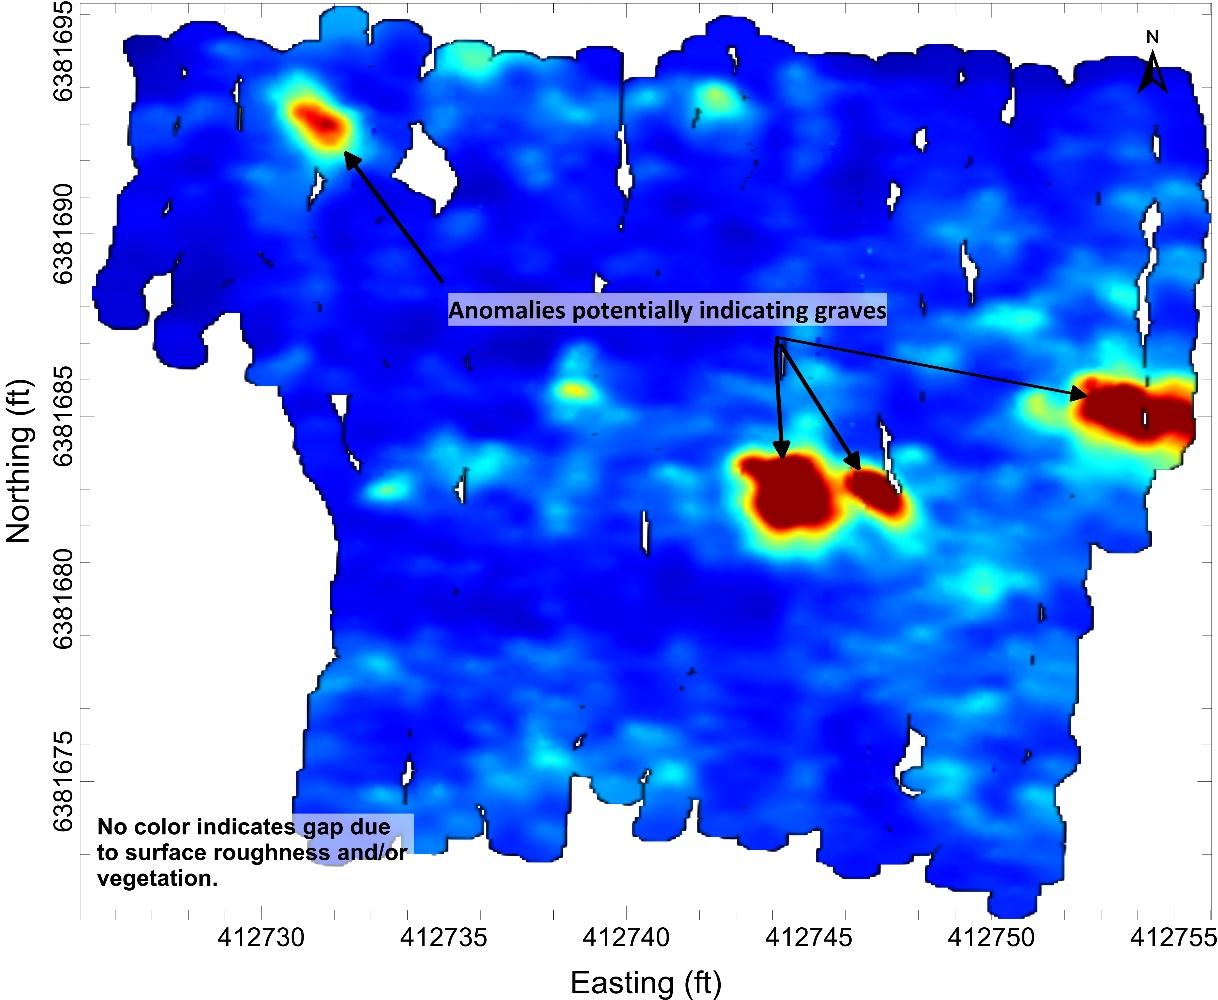
The interpretation workflow consisted of visualizing the depth slices from the surface downwards in each 0.05-meter increment combined with displaying the relevant profile line at each anomaly location. Visualizing the depth slices and the profiles (Figures 4 and 5) simultaneously allows the interpretation of anomalies that have both a higher-than-background reflection strength in the depth map and the expected shape and intensity in the profile views. For this data set, the response viewed in the GPR profiles (for example, Figure 4) was more easily interpretable than the depth-slice response. This situation is uncommon for gridded GPR data, and therefore interpretation was more difficult than normal. Ground-truth information, in the form of marked locations within the data set where graves were confirmed by surface features, enabled calibration and validation of the anomalies. Having this tool was essential for reliably interpreting this data set. Finally, interpreted grave locations were output in real-world coordinates for viewing in geographic information systems as desired. This approach allows the relevant shareholders to incorporate the interpreted anomalies into their own maps and plans.
Results and Discussion
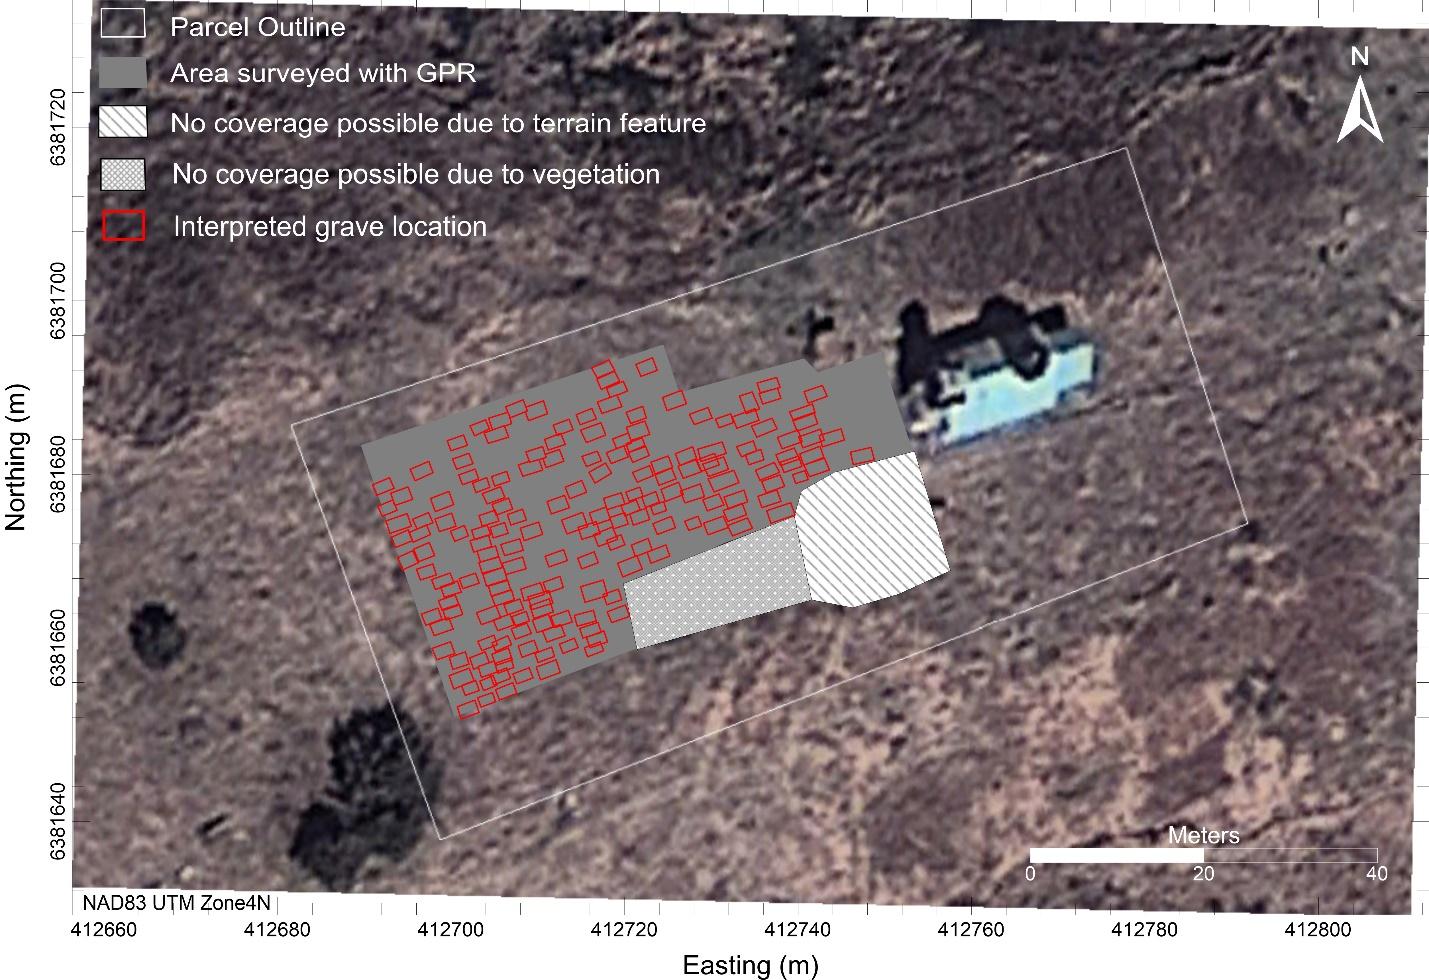
A total of 174 likely graves were interpreted from the GPR data (Figures 5-7) ranging from 0.6 to 2 m below surface. In some cases, there are likely burials co-located or overlapping at different depth levels. There is a noticeable gap in burial density directly in front of the church entrance. Otherwise, the graves are distributed across the site with minor variability in spacing and grouping. Denser burial areas likely occur in the middle of the survey area and near the southwest corner. Unfortunately, the southeastern areas were excluded from the survey, due to surface conditions, so interpreted grave locations in those areas were not available before the church move.
Although not shown well on the imagery due to the recent acceleration of the bluff’s erosion, the northernmost interpreted grave sites are within 5 m of the edge of the slope. While the slope adjacent to those northern graves is still vegetated and gradually sloping (Figure 3), encroachment on the cemetery itself is possible as coastal erosion is likely to continue for the foreseeable future given the state of the climate. In that event, relocation of graves may be required for preservation.
Conclusion
Archaeological sites including cemeteries around the world may be threatened by various side-effects of the changing climate, including erosion; storm events; and, in the Arctic, degrading permafrost. Geophysical methods including ground-penetrating radar provide a non-invasive way to survey these sites. Implementation of a non-invasive method to map grave locations is essential due to the cultural sensitivity of these sites. GPR is widely recognized as the best-available technology to do so, yet the tool comes with potential traps and pitfalls for the unwary or inexperienced user. For example, soil conditions may violate common assumptions about wave velocity and penetration, leading to invalid or uninterpretable results. The age and condition of the burials is also a factor; older burials are generally harder to locate, and bodies interred without coffins more difficult than those in coffins. From the implementation side, survey design is paramount: choice of frequency and line spacing play a large role in the percentage of successful results as shown by previous work. In this study, we used a central frequency of 500-MHz as being able to resolve fine-scale features while still penetrating deeply enough to map burials at the expected depths. Our line spacing of 0.25 m was dense enough to map the graves in this location. Our choice of wider line spacing was due to the variable surface conditions at the site and the limitations of time, being forced to fly into and out of the village within the same day due to Covid-19 concerns. The manufacturer-recommended line density of 0.1 m for this frequency should be chosen when conditions permit.
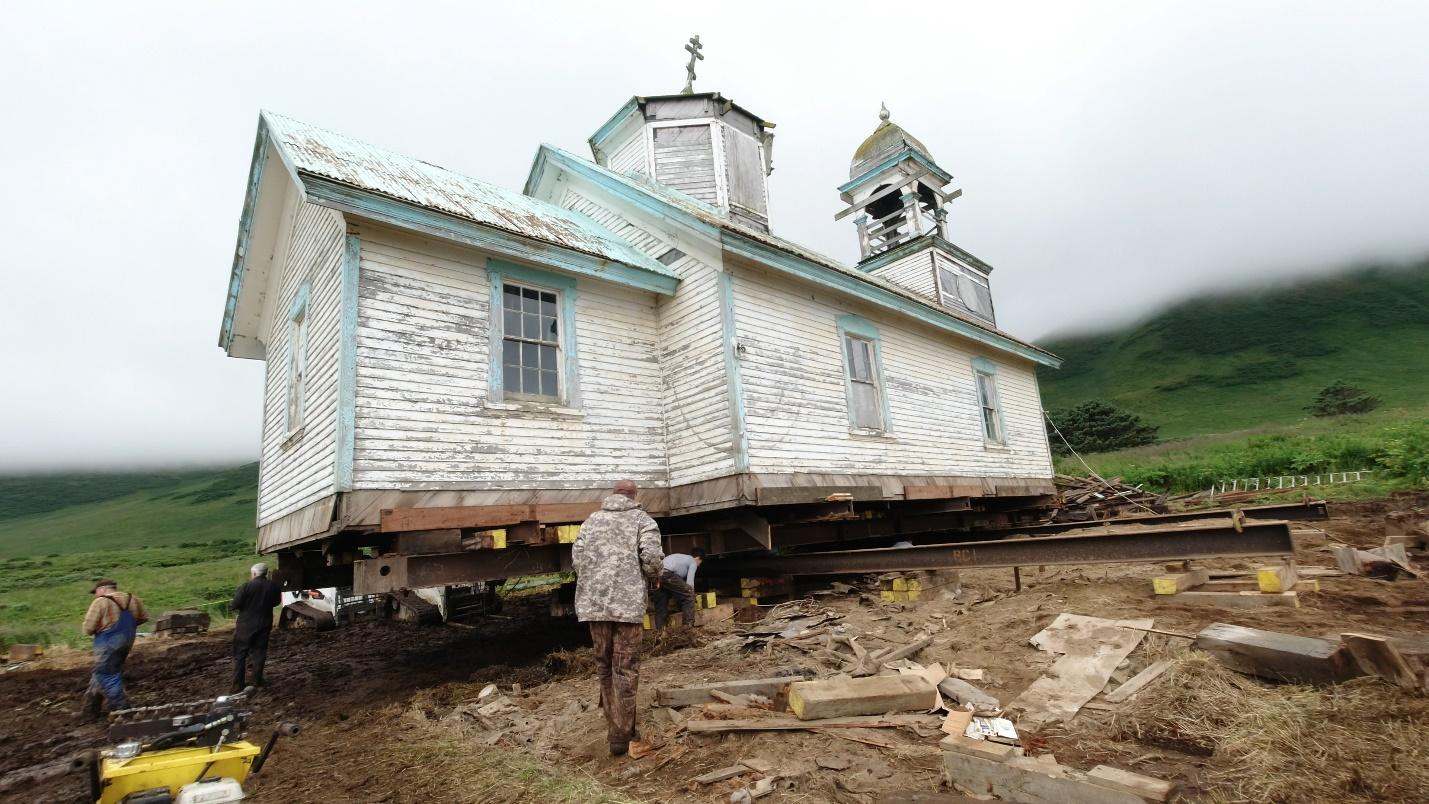
In spite of the remote location and multiple adversarial logistical and site considerations, the survey successfully mapped nearly 200 likely grave locations within the 1,400 m2 area. Subsequently, the church move was completed with this GPR-derived information in hand enabling the protection of the graves during the move (Figure 8). The church’s new location within the cemetery but further inland will provide temporary protection for the structure in the face of continued erosion of the bluff. Future work will include surveying the remaining cemetery area in fall 2021 to provide additional maps of interpreted grave locations throughout the remaining cemetery in preparation for the final church relocation.
Acknowledgements
I would like to thank ROSSIA for facilitating and funding this work; the village of Karluk for providing site access; and the National Park Service for general support, site knowledge, and maps, with a special thank you to Dorothy Gray, Shina DuVall, and Grant Crosby.
Annan, A. P., 2005, Ground-Penetrating Radar. In D. K. Butler, Near-Surface Geophysics (pp. 357–438). Society of Exploration Geophysicists. http://library.seg.org/doi/abs/10.1190/1.9781560801719.ch11
Bradford, J.H., 2018, Ground-penetrating radar surveys of late-19th and early-20th century cemeteries to identify unmarked graves in rural Idaho, USA: SEG Technical Program Expanded Abstracts, p. 2652-2656. https://doi.org/10.1190/segam2018-2998468.1
Dick, H.C., Pringle, J.K., Wisniewski, K.D., Goodwin, J., van der Putten, R., Evans, G.T., Francis, J.D., Cassella, J.P., & Hansen, J.D., 2017, Determining geophysical responses from burials in graveyards and cemeteries: Geophysics, v. 82: B245-B255. https://doi.org/10.1190/geo2016-0440.1
Jol, H. M., 2009, Ground-Penetrating Radar: Theory and Applications. Elsevier Science.
Jones, B.M., Arp, C.D., Jorgenson, C.T., Hinkel, K.M., Schmutz, J.A., &Flint, P.L., 2009, Increase in the rate and uniformity of coastline erosion in Arctic Alaska. Increase in the rate and uniformity of coastline erosion in Arctic Alaska: Geophysical Research Letters, v. 36, no. 3. https://doi.org/10.1029/2008GL036205
Melvin, A. M., Larsen, P., Boehlert, B., Neumann, J. E., Chinowsky, P., Espinet, X., Martinich, J., Baumann, M. S., Rennels, L., Bothner, A., Nicolsky, D. J., & Marchenko, S. S., 2017, Climate change damages to Alaska public infrastructure and the economics of proactive adaptation: Proceedings of the National Academy of Sciences of the United States of America, v. 114, no. 2, E122–E131. https://doi.org/10.1073/pnas.1611056113
Naske, C.M., & Slotnick, H. E., 2011, Alaska: A History. University of Oklahoma Press.
Nerem, R.S., Beckley, B. D., Fasullo, J. T. , Hamlington, B. D., Masters, D., & Mitchum, G. T., 2018, Climate-change–driven accelerated sea-level rise detected in the altimeter era: Proceedings of the National Academy of Sciences: v. 115, no. 9, 2022-2025. DOI: 10.1073/pnas.1717312115
Schneider, B.B., Tsoflias, G., Steeples, D.W., Mandel, R., & Hofman, J., 2018, Bone permittivity and its effect on using ground-penetrating radar: Geophysics, v. 83, p. H1-H11. https://doi.org/10.1190/geo2017-0128.1
Steffian, A., Leist, M., Haakanson, S., and Saltonstall, P., eds., 2015, Kal’unek-from Karluk: Kodiak Alutiiq History and the Archaeology of the Karluk One Village Site. Elsevier Science.
Urban, T.M., Anderson, D.D., & Anderson, W.W., 2012, Multimethod geophysical investigations at an Inupiaq village site in Kobuk Valley, Alaska: The Leading Edge, v. 31, p. 950-956. https://doi.org/10.1190/tle31080950.1
Witten, A., Brooks, R., & Fenner, T., 2001. The Tulsa Race Riot of 1921: A geophysical study to locate a mass grave:. The Leading Edge, v. 20, p. 655-660. https://doi.org/10.1190/1.1439020
Author Bios:

Esther is geophysicist and owner at Logic Geophysics & Analytics LLC. Her field of expertise is in near-surface geophysics, engineering geophysics, environmental site investigation, environmental policy, project managementand ground-penetrating radar
