
Paulo Edmundo da Fonseca Freire1, Marcos Vinicius Reis e Pimenta2, Willian Ricardo Ritter3
1Paiol Engenharia
2Cpfl Energias Renováveis S.A.
3Elera Renovaveis
Abstract
The Gameleira Windfarm, with 23 wind turbines, is in the coastal Potiguar Basin, Rio Grande do Norte, Brazil. The design of a grounding system generally involves two main activities – building the ground geoelectric model and simulating the grounding system. The simulation of a complex grounding system such as a windfarm requires a deep ground model compatible with its extension, on the order of a few kilometers. This paper presents the work developed to construct a deep 1D geoelectric model based on the combination of shallow Wenner survey with a near-surface Audio-magnetotelluric (AMT) survey.
Introduction
The Gameleira Windfarm has a total of 23 wind turbine towers grouped in four clusters – Costa das Dunas (CD), with eight wind turbines; Farol de Touros (FT), with seven wind turbines; Gameleira (GAM) with five wind turbines and Figueira Branca (FB) with three wind turbines (Figure 1). The wind turbines are interconnected to the Gameleira 230 kV substation through double circuit 34.5 kV overhead lines. The interference-free maneuvering areas at the bases of the towers are approximately 60 m x 34 m. The CD-01 and FT-01 towers have a reinforced concrete base ( 18.6 m) without piles, all the other towers have a reinforced concrete base ( 15.8 m) with 30 steel piles of 12 m in length. The 230 kV substation is located between the CD-7 and CD-8 towers. Figure 1 shows the location of the municipality of Touros, in the coastal Potiguar Basin, Rio Grande do Norte, Brazil, where the windfarm is located. Cenozoic alluvial sandy sediments form the Potiguar Basin. Touros sits on the edge where the Brazilian coast turns South, an excellent location served by steady winds that blow from the Atlantic Ocean. Figure 2 reveals that the windfarm is located a few kilometers from the coast, on well-drained sandy soil, with high resistivity in the shallow layers. The windfarm is about 50 m above sea level, anchored on the sandy Cenozoic Barreiras Formation (ferruginous sandstone), which sits above the Cretaceous Jandaira and Açu Formations. The geoelectric model here developed shows a lower resistivity ground layer about 100 m depth, associated with the penetration of the saline water wedge in the coastal region, and the crystalline basement almost 1 km depth.
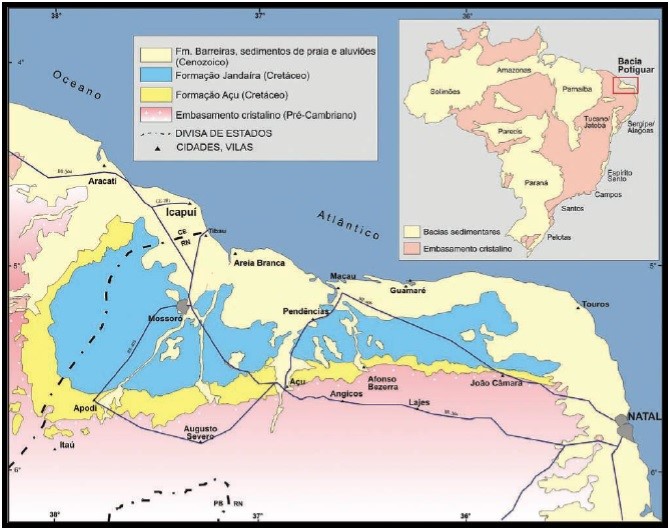
Figure 1. Location of the Potiguar Basin on the Northeast coast of Brazil.
The grounding of the towers’ bases is constituted by the steel armor of the foundations interconnected to grounding rings of 70 mm² bare copper cable. From the external grounding ring to the foundation, two radial counterpoises derive – one buried on the side of the maneuvering yard (with 50 m in length) and another buried in the bottom of the 34.5 energy cables trench, up to the base of the 34.5 kV line pole, where it is done the interconnection of the line to the aerogenerator tower. Due to the earth fault current limitation of 400 A in the 34.5 kV network, there is no risk of dangerous step and touch voltages occurring at the bases of wind turbine towers. A copper-plated steel grounding cable, 70 mm² 30% IACS (International Annealed Copper Standard), is laid along the axis of the medium-voltage overhead line, interconnecting the towers’ groundings. This cable also acts as a shielding element for attenuating overvoltages induced in the aerial 34.5 kV line conductors by indirect lightning, especially those incidents on the wind turbine blades. However, this shielding would be more effective if this cable were installed as an earth wire, closer to the phase conductors of the lines. The supplier of wind turbines (Gamesa) requires a grounding resistance at the bases of the towers of less than 10 Ω. This resistance is usually challenging to obtain with the grounding of only a single tower base, being advisable the interconnection of the bases of the several towers of the windfarm to achieve the required grounding resistance. The grounding system of a windfarm, consisting of concentrated groundings at the towers’ bases interconnected by long conductors (overhead or buried along the interconnecting energy lines), cannot be considered equipotential due to its kilometric length. Therefore, the simulation of this grounding system requires adequate software, which considers the voltage drops along the long interconnecting line, and a deep ground geoelectric model, about 1 km depth.

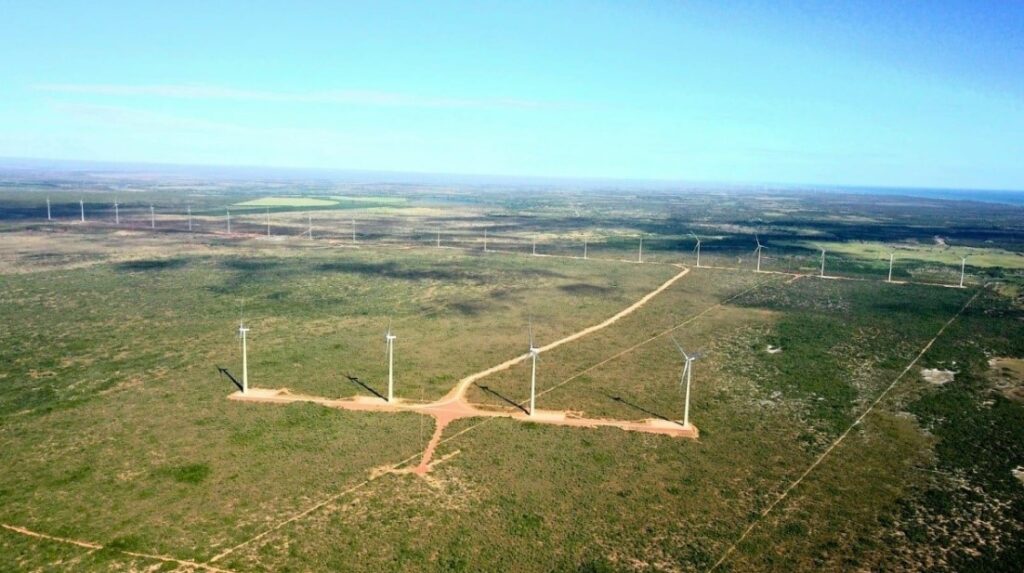
Figure 2. Layout and an aerial view of the 23 aerogenerator towers of Gameleira Windfarm.
Geophysical Surveys
For the construction of the deep soil geoelectric model, two geophysical surveys were carried out, a shallow survey with vertical electrical soundings (VES) and a near-surface Audio-Magnetotelluric survey (AMT), executed by: (a) GeoEnergy used to deploy 23 VES at the tower locations, with Wenner array and spacings of up to 64 m; and (b) Strataimage used to deploy 14 electromagnetic soundings with the AMT technique, with Phoenix Geophysics equipment, along a survey line with AMT stations, spaced about 0.5 km, to produce a 2D profile along the main windfarm axis. In addition to these surveys, five VES were readily available in the substation area to design its grounding grid. The availability of two apparent resistivity curves, one shallow and the other near-surface, obtained from different geophysical sounding methods, allowed the inversion of the apparent resistivity curves with the adjustment of static deviations, which affect both sounding techniques, resulting in a geoelectrical model with more than 800 m depth and consistent with the regional geology. The inversion of the apparent phase and resistivity curves is a mathematical procedure that infers the subsurface electrical resistivity (ρ) structure obtained from the parameters measured in situ on the ground surface. The inversions of the VES (Wenner) and AMT curves were performed using the software IPI2Win [3].
VES Soundings (Wenner Array) for shallow characterization
In addition to the five VES made in the substation area (Figure 3a), 23 soundings were done with a DC resistivimeter (CDC 1000/12R2A/CTRLTECH) in all locations of wind turbine towers, along two orthogonal alignments, with a Wenner arrangement and spacings of 1, 2, 4, 8, 16, 32 and 64 m. Figure 3b presents the set of 24 apparent resistivity curves (in the 23 towers plus the substation average curve). This second graph shows three average curves: the substation average curve, the windfarm average curve weighted by the inverse of the tower’s distance to the substation (red curve), and the average of the two latter curves. From the human safety point of view, the most critical short circuit that can occur in the windfarm electrical system is the line-to-ground fault on the 230 kV busbar at the substation, whose grounding grid, together with the groundings of the nearest towers, will dissipate part of the fault current to the ground, resulting in step and touch voltages, which may be dangerous for people in the area. For this reason, it was calculated the windfarm apparent resistivity average curve through the weighted geometric mean. The geometric mean is compatible with the log-normal distribution of the ground resistivity parameter [5]. The weighting is based on the inverse of the distance from the substation to the geoelectrical sounding point, which are the locations of the towers. Therefore, the resistivity of the ground close to the substation is more critical than the resistivity of more distant places. Despite the same pattern of the windfarm curve, the substation resistivity curve presents higher values, which can be explained by the fact that the Wenner survey carried out in the substation was made with a ground meter. This low-power AC equipment usually measures upward biased apparent resistances in soils with resistivity above 1000 Ω-m. The analysis of this family of electrical resistivity curves reveals that despite the good consistency in terms of pattern, in each sounding spacing, a significant spread of the apparent resistivities is observed in a range of the order of up to a decade. The variability of the resistivity values of shallow soil layers is expected. However, it is known that geophysical soundings that measure the electric field at the soil surface (both Wenner and AMT soundings) are affected by the so-called static deviation (static-shift), which vertically shifts the apparent resistivity curves. These deviations occur due to resistivity variations in the very shallow soil layers above the minimum depth probed by the method., which result in the accumulation of electrostatic charges at the interfaces of volumes of different resistivity and which are sensed by the voltage measuring electrodes as potential sources within the ground. It is important to remember that the expression of the Wenner arrangement is deduced under the premise that there are no potential sources in the ground. The Wenner arrangement displaces the four electrodes for each measurement. Therefore, each measured spacing of each curve is affected by different levels of static deviation, according to the characteristics of the very shallow ground in between the potential electrodes, contributing to the spreading of the curves seen in Figure 3b.
The means adopted in this project to reduce (but not eliminate) the static deviations were to calculate an average curve (red curve in Figure 3) based on a significant dataset. The non-complete elimination of static deviations can occur because the entire set of apparent resistivities may be shifted up or down. To further reduce the static deviation of the average apparent resistivity curve, it is required to combine with a complimentary sounding technique, so-called AMT sounding.


Figure 3. Wenner apparent resistivity curves were measured at the substation (a) and the towers’ locations (b).
Figure 4 presents the apparent resistivity inverted to determine the shallow ground geoelectric model. The black line shows the geometric average curve between the substation and the windfarm curves. The corresponding 1D geoelectric model (blue line) and the adjusted curve from the model (red) are also shown. The inversion was performed with the software IPI2Win [3]. The curves end with a downward trend, which means that the deeper ground layers are indeterminate due to a sounding limited by an insufficient measuring spacing for a good characterization of the regional basement. For this reason, the shallow geoelectric model can only be considered well characterized after the joint analysis with the AMT soundings.
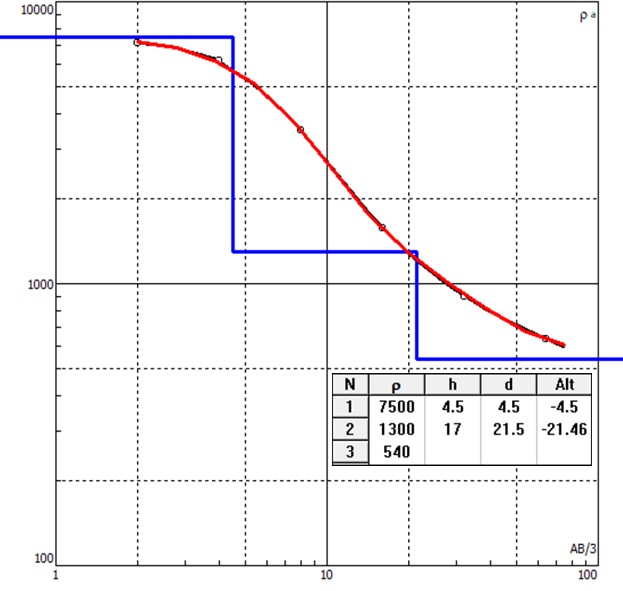
Figure 4. Wenner apparent resistivity curve (Ω-m) x spacing (m) and corresponding geoelectric model (blue line and table).
AMT Soundings for Deep Characterization
For the development of the AMT 1D model, the geometric average of the two apparent resistivity curves was calculated and the arithmetic average of the two phase curves (TE and TM). The two average curves form the invariant, a single pair of apparent resistivity curves and phases x period (inverse frequency, in seconds) associated with a 1D geoelectric structure. This model assumes an anisotropic geoelectrical structure on the X and Y axes, which varies only on the z (vertical) axis, that is, in depth. Figure 5 presents the invariant 1D AMT curves (apparent resistivities and phases) for the 14 tower locations and the corresponding average curve (red). Compared with the Wenner curves, a more uniform pattern is observed in this set of curves, with less spread, especially at the central frequencies, which do not present the variability of the lower periods and the noisy signals of the larger periods. The uniformity of these curves can be interpreted as a subsurface structure formed by relatively uniform layers throughout the windfarm area, allowing the adoption of a unique regional near-surface model for the layers starting about 60 m depth.


Figure 5. 1D apparent resistivity (a) and phase (b) curves calculated from the 14 AMT stations.
Construction of the Ground Geoelectric Model
The geoelectrical modeling aims to produce a single ground geoelectric model for the entire windfarm, compatible with its extension and as viewed from the substation, to where all the towers’ grounding systems converge. Figure 6 shows the average apparent resistivity curves – Wenner (green) and AMT (yellow), plotted on the same graph, with the Wenner measurement spacings converted into periods by Meju’s empirical expressions [6]. The two curves should overlap in the period 0.0001 s. However, they present a deviation of the order of 440 Ωm. Therefore, as expected, both curves present vertical deviations, the Wenner curve is upward shifted, and the AMT curve is downward shifted. This deviation can be attributed to the static shift, which affects both curves, meaning that the combined curve of the two sounding techniques is expected to be within a range of ± 220 Ωm between the tail of the Wenner curve and the head of the AMT curve. Rung-Arunwan et al. [7] demonstrate that if there is galvanic distortion (static shift), the invariant (1D curve) of the MT impedance will always be shifted downwards, even for a 1D regional structure. This finding shows that if no adjustment is applied, the 1D geoelectric model obtained will always result in a more conducive and deeper regional model than the real one.

Figure 6. Average apparent resistivity curves – Wenner (green), AMT (yellow), and adjusted Wenner (brown) and AMT (red).
Considering the findings presented above, the graph in Figure 6 shows the two average curves adjusted by the same factor, which means an intermediate adjustment. The Wenner curve (green) was divided by an adjustment factor of 1.85, and the AMT curve (yellow) was multiplied by the same factor of 1.85. With this adjustment, the Wenner curve’s tail overlaps the head of the AMT curve, promoting a smooth transition between the shallow and near-surface models. The phase curve of the AMT sounding (Figure 7b) remains unchanged throughout this process. Figure 7a presents the result of the inversion of the Wenner curve of apparent resistivities adjusted by the reduction factor 1.85 – calculated (black) and inferred (red), and the corresponding geoelectrical model with three layers (blue line and table). There is a significant reduction concerning the original shallow model, presented in Figure 3b. Figure 7b presents the AMT apparent resistivity curve adjusted by the multiplier factor 1.85 and inverted with the help of the IPI2Win software, with the imposition of the previously adjusted shallow Wenner model. The graph shows the calculated (black) and inferred (red) 1D apparent resistivity curves and the corresponding geoelectrical model with six layers (blue line and table). Table 1 summarizes the result of the inversion with its geologic interpretation, which represents the 1 km depth geoelectrical ground model, as viewed from the substation, used for the study of the Gameleira Windfarm grounding system.

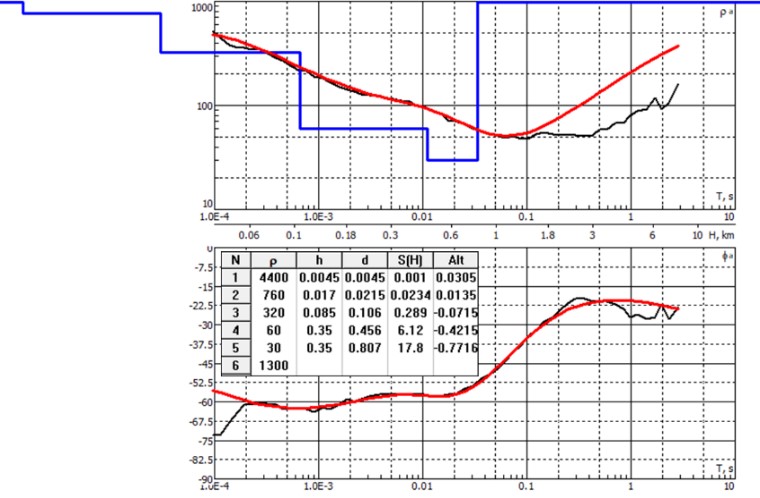
Figure 7. Adjusted apparent resistivity curves (brown and red in Figure 5) and corresponding 1D geoelectric models – Wenner (a) and AMT (b); with the input curves (black), inferred (red), and geoelectric models (blue line and table).
Table 1. 1D geoelectric model and corresponding geologic interpretation.

Conclusions
The methodology applied in this paper allows for the simultaneous development of a deep (1 km) geoelectric ground model, compatible with the dimensions of the modern renewable energy power plants and static-shift adjusted. A significant improvement of the ground model was obtained by integrating both Wenner and AMT soundings (Figure 6b) compared with the traditional model obtained from only the traditional Wenner soundings (Figure 4). Using a geoelectric model based only on a shallow geophysical survey would result in a model with much higher resistivities and, consequently, a more expensive project, which would require more grounding conductors. For a typical substation, the cost of the grounding system is not significant compared with the total cost of the construction. However, for renewable generation plants, with kilometric dimensions, as is the case of windfarms and large photovoltaic plants, the design of the grounding system using a more sophisticated methodology is fully justified.
The geoelectrical modeling methodology used in these projects was initially developed to design ground electrodes for the Madeira River and Belo Monte HVDC systems, which require geoelectrical models covering at least the upper crust (20 km deep) [8, 9]. In addition to the Gameleira Windfarm, the design of the following grounding systems applied this same methodology: Bom Jardim da Serra windfarm (Energimp, 2019) [10], Sol do Sertão (Araxá, 2020) and Sol do Cerrado (Grupo Energia, 2022) photovoltaic plants. The recent revision of the Brazilian standard NBR7117/2020 – Resistivity Surveys and Geoelectric Modeling [11, 12] recommends applying the geophysical procedures used in this article.
References
[1] IEC -TR61400-24 – Wind Turbine Generator Systems – Lightning Protection.
[2] Windfarm Grounding, 2016 CIGRE C4 International Colloquium on EMC, Lightning, and Power Quality Considerations for Renewable Energy Systems, Curitiba (março/2016).
[3] Bobachev C. IPI2Win: A Windows software for an automatic interpretation of resistivity sounding data. Ph.D. Thesis. Moscow State University. Russia. 2002
[4] De Lugão PP, Kriegshäuser BF, Freire PEF, Geoelectric modelling of near-surface resistivity distribution for the design of windfarm grounding grids. EAGE – Near Surface Geoscience Conference & Exhibition 2019, 8-12 September 2019, The Hague, Netherlands
[5] Freire PEF, Pereira JM, Borin PFO, Jardini JA. Brazilian Standard NBR-7117/2012 – A Review Proposal. International Conference on Grounding and Earthing & 7th International Conference on Lightning Physics and Effects. Porto de Galinhas, Brazil. June 2016
[6] Meju MA. Simple relative space-time scaling of electrical and electromagnetic depth sounding arrays: implications for electrical static-shift removal and joint DC-TEM data inversion with the most-squares criterion. Geophysical Prospecting 53. 2005.
[7] Rung-Arunwan T, Siripunvaraporn W, Utada H. On the Berdichevsky average. Physics of The Earth and Planetary Interiors. February 2016.
[8] Freire PEF, Pereira SY, Padilha AL. Adjustment of a crustal geoelectric model from commissioning data of HVDC ground electrodes: A case study from the Northeastern Paraná Basin, Brazil, Journal of Applied Geophysics, October 2020.
[9] Freire PEF, Pereira SY, Padilha AL. Adjustment of the Geoelectric Model for a Ground Electrode Design – the case of the Rio Madeira HVDC Transmission System, Brazil. Cigre Science & Engineering Journal. February 2021
[10] Freire PEF, Silva NRA, Minatto JZ, Schweig C, De Lugão P, Kriegshäuser B, Porsani JL. Geoelectric modeling for the retrofit of the grounding system of the Bom Jardim da Serra windfarm. Ground 2020/21 & LPE – International Conference on Grounding & Lightning Physics and Effects. Belo Horizonte, Brazil, June 2021.
[11] NBR7117/2020 – Medição de Resistividades do Solo e Modelagem Geoelétrica
[12] Freire PEF, Zancanela JH, Takayanagi H, Jardini JA, The review of the Brazilian standard NBR-7117 – Ground resistivity surveys and geoelectric modeling. Ground 2020/21 & LPE – International Conference on Grounding & Lightning Physics and Effects. Belo Horizonte, Brazil, June 2021.
Author Bios

Paulo Edmundo da Fonseca Freire was born in 1955. He is an Electrical Engineer (1978) and MSc. in Power Systems (1984) from PUC-RJ. He obtained his PhD. in Geosciences from Unicamp (2018). Currently, he is a Director of PAIOL Engenharia. He has 40 years of experience in studies and projects of grounding and lightning protection systems for energy networks and commercial, industrial, and transport facilities. He is a former professor at Gama Filho University, instructor/speaker of courses and events, and author of papers presented at congresses and seminars in Brazil and abroad. He has international experience in Brazil, Chile, Angola, Kenya, and Ethiopia projects. He is a member of the ABNT/COBEI, IEC, and Cigre committees. paulofreire@paiolengenharia.com.br
Marcos Vinicius Reis e Pimenta
Marcos Vinicius Reis e Pimenta was born in 1982. He is an Electrical Engineer (2009). He is currently a Specialist in Electrical Engineering I at CPFL Renováveis. He has 20 years of experience in projects of Hydroelectric, Wind, Thermal and Industrial Plants. He has international experience in projects in Brazil, Ecuador, Nicaragua and Angola.
Willian Ricardo Ritter
Willian Ricardo Ritter is a professional in the energy sector with 24 years of experience developing, implementing, commissioning, and managing energy generation and transmission, telecommunications, and industrial installations projects. The leading professional challenges were the projects for the modernization of the data transmission backbones in the southern region of Brazil, wind generation projects, construction and commissioning of the hydropower plant Santo Antônio and the main projects and studies of large generation solar plants from CPFL and Elera Renováveis.
