
Jonathan S. Miller, Gregory Schultz, Joe Keranen, Fridon Shubitidze, Jack Foley
White River Technologies, Inc.
Lebanon, NH
Abstract
Over the past two decades, implementations of multi-axis, multi-sensor designs for electromagnetic induction (EMI) have led to new capabilities for UXO clean-up professionals in discriminating potentially hazardous munitions and explosives of concern (MEC) from non-hazardous metal debris. The ability to classify these potentially hazardous targets with high confidence allows for lower site remediation costs through reduced excavation of innocuous metal objects (i.e., clutter). The effectiveness of the EMI-based UXO classification methodology has been established through the implementation of the US DOD Advanced Geophysical Classification Accreditation Program (DAGCAP) and the associated international ISO/IEC 17025 standard. Here we present recent developments in Advanced Geophysical Classification (AGC) sensor technologies that we have produced to maximize cost reduction through effective classification and efficient survey design.
Introduction
The initial intent of the AGC sensor technologies was to provide a means for inserting additional steps into the existing data collection and processing workflows for Munitions Response (MR) projects without altering the established protocols. Accordingly, the cued survey process was developed as an add-on to the existing geophysical survey workflow for such projects. By relying on the standard digital geophysical mapping (DGM) survey data for target picking, advanced sensors could be incorporated into the existing process in cued mode (i.e., to “cue” on those targets) with minimal impact to the overall flow; however, with the continuous improvement in AGC sensors and processing methods, it has become possible to perform a high level of classification with the mapping survey. This dynamic classification approach removes the need for subsequent cued surveys, thus further improving the cost benefits of AGC.
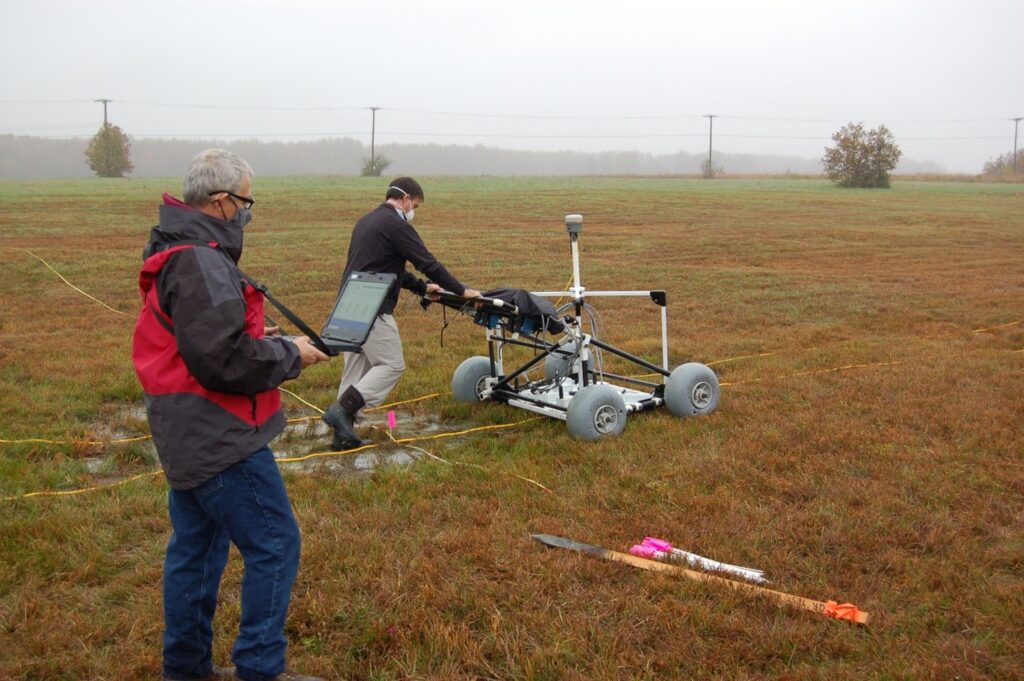
White River Technologies, Inc. recently demonstrated a dynamic AGC sensor, known as APEX (Figure 1), at the Aberdeen Proving Ground (APG) UXO test site. Through successful completion of this demonstration, the APEX was approved by DAGCAP for use on munitions response projects in the U.S. The APEX represents the culmination of a decade of research and development in and fielding of dynamic AGC sensor technologies. While APEX is now approved for Informed Source Selection, Cued AGC, and Dynamic AGC, this article includes some of our lessons learned in transitioning dynamic AGC technologies from R&D to the production environment.
Cued AGC: Pros and Cons
Cued AGC works. This fact has been established through over 15 years of demonstrations and production-level field activities that have shown that static measurements with advanced EMI sensors produce high-resolution data that yield classifiable features. These features, called electromagnetic polarizabilities, enable high-confidence decisions about whether a subsurface target is a piece of scrap metal or a potentially hazardous MEC item. The primary reason cued AGC has offered such enhancements when compared to conventional DGM sensors is because the advanced sensors used for AGC provide multi-axis, electromagnetic measurements of the subsurface, which enable the extraction of principal component features (i.e., polarizabilities); however, an additional benefit of cued AGC is the measurement approach itself, which allows for long dwell times (10’s of seconds) over a subsurface object. This measurement period fundamentally increases the signal-to-noise ratio (SNR) of the data through basic stacking and averaging of samples.
While the longer dwell time is a significant advantage, there are several disadvantages about the cued AGC approach. The most notable disadvantage is the production rate of cued surveys. While it is generally accepted that adding a cued AGC survey after the DGM stage to reduce excavations is more cost effective than excavating every target identified by DGM, it is still a costly step. Typical production rates for cued AGC surveys are in the range of 200 – 300 anomalies per day. Therefore, depending on the site size and density, this production rate can lead to extra days, weeks, or even months of keeping a survey team in the field. While this cost may be smaller than that required to excavate every piece of scrap metal, it is still significant when compared to the cost of the DGM survey alone.
Another less obvious disadvantage of cued AGC is the requirement for dedicated background measurements. Because cued measurements over a buried target include the background response from the soil as well as the target response, accurate measurements of the soil background are required to effectively remove this response from each cued measurement. The soil response (as well as that of any peripheral metal components on the system such as a tow vehicle) create a bias in the cued measurement. If the background bias can be accurately measured in the absence of a target, then it can be effectively removed from subsequent measurements to leave solely the target response. This process, however, is difficult to implement perfectly in practice. Soil background response can be highly variable throughout a site due to changes in geology that effect the electromagnetic response. While small changes in background levels do not have much impact for high SNR targets, they will erode the sensitivity of the cued measurement by leaving a residual bias in the lower SNR targets. In other words, it can be difficult to find background locations throughout a site that can be used effectively on every cued target measurement to ensure that no residual background response remains in the data.
A secondary disadvantage of the background measurement is the onerous task of tracking and validating background measurements. Determining if background locations are representative of the site geology requires several measurements around each potential location and a rigorous statistical analysis of the data. Considering that large sites require numerous background locations to account for changes in the local geology throughout the survey area, this process can be time consuming. Furthermore, throughout the survey to account for time-varying changes in the background response, background measurements are required at a frequency that is on the order of every hour. It is apparent that the process of selecting, validating, and measuring background locations for cued surveys can add significant field and analysis time to a project. A final, notable disadvantage of the static cued survey is the strict sensor positioning requirement. To ensure that the measurement includes the optimal target response, it is necessary to position the sensor directly over the buried target with an accuracy that is typically on the order of 10’s of centimeters. This requirement often leads to additional measurements of the same target with a repositioned sensor. While in-field inversion of the data can improve the accuracy of these “re-shots”, this process further increases the time-consuming nature of the static cued measurement.
Dynamic AGC: Why it Works
The alternative to cued AGC is dynamic AGC, that is to use the advanced EMI sensor as a DGM sensor. With this approach, the mapping survey is performed with a multi-axis, high resolution EMI sensor and classification decisions are made based on the dynamic survey data instead of requiring additional cued data. Dynamic AGC has the obvious cost benefit of no follow-on cued survey, thus saving significant time and equipment costs associated with an extended field phase. The main drawback compared to cued AGC, however, is that we no longer have the ability to increase SNR through an extended dwell time since the sensor is constantly moving. It turns out though, that this challenge can be overcome to a large extent through appropriate data processing techniques.
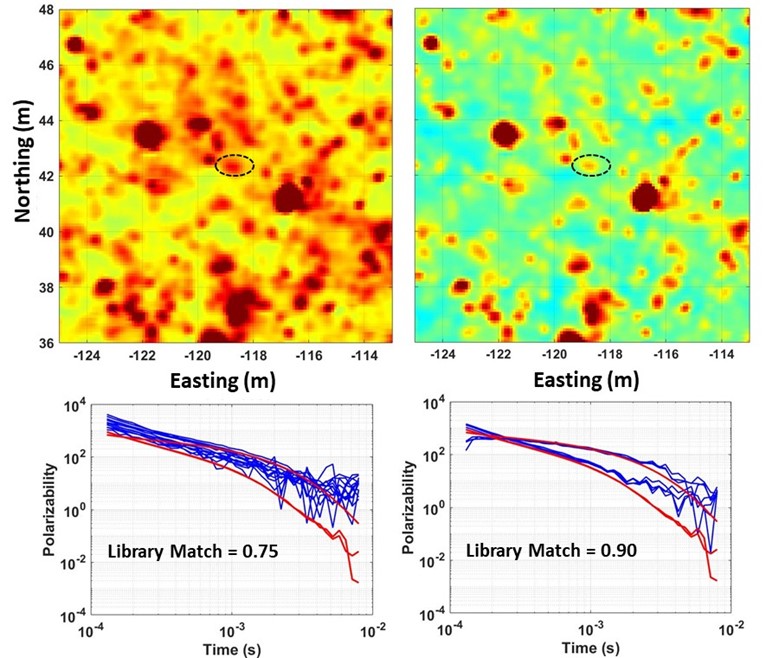
First, consider the implications of the background correction in the case of dynamic AGC. We have discussed how small inaccuracies in the background response correction can reduce the sensitivity of the static cued AGC sensor. Because the dynamic sensor acquires data over the areas surrounding each target as well as directly over the target itself, we are able to produce a continuous representation of the background response throughout the survey area. By applying highly localized background corrections to each anomaly associated with a subsurface target, we can optimize the background correction process to maximize the sensitivity to each anomaly (Figure 2). This approach can therefore enhance sensitivity to low SNR targets compared to the static cued background correction method.
Next, consider that during a dynamic AGC survey, as the sensor passes over each subsurface target, it produces several measurements of the target at different lateral offsets. This “encounter”, therefore, can be viewed as a cumulative measurement that lasts several seconds (depending on the size and depth of the target). While it is not a “static” measurement (as would be the case for a cued survey), it provides a similar dwell time that can be used to increase SNR in a similar manner.
The net result is that the apparent SNR disadvantage of the dynamic survey can be mostly, if not entirely, mitigated with effective processing methods. The improved resolution of background variability and the accumulation of “multiple looks” at each target allow us to compensate for the inherent lower SNR associated with a dynamic survey when compared to the static survey.
Dynamic-Cued AGC: A Hybrid Approach
Dynamic AGC offers the potential for significant cost reduction by reducing field time associated with cued AGC and intrusive investigation of large amounts of scrap metal, yet there may be some benefits to using additional cued measurements after the initial survey for certain projects. After dynamic data classification, the majority of targets that are placed on a ranked dig list fall into one of two categories: high confidence Targets of Interest (TOI) or high confidence non-TOI; however, there is often a small subset (typically 5-15% of the total targets) that fall into a lower confidence decision category. Some of these items may have low SNR, poor model coherence, or may have polarizabilities that are representative of TOI, but that do not match a catalogued library polarizability with a high confidence match value.
If the analyst cannot conclusively determine these items are non-TOI, then the items are slated for intrusive investigation. Depending on the specific project constraints (e.g., whether AGC teams are still in the field, scheduling of dig team operations, etc.), there may still be some cost benefit to performing a cued reacquisition of these items before excavating all of them. For these targets, it is possible to reap the benefits of both improved background removal and higher SNR by using a hybrid method we call the “Dynamic-Cued” approach.
This method consists of acquiring short transects over the cued target location. These transects are long enough to provide sampling of the local background, but short enough that they only require a few 10’s of seconds to acquire. Additionally, as the sensor passes directly over the target location, it is possible to pause for several seconds to accumulate samples for stacking to further improve SNR. To manage cued reacquisition in higher density areas, it is also possible to acquire these short transects in multiple directions to ensure optimal sampling of the background and the target itself. The result is a focused, dynamic survey that requires on the order of 1-minute to complete (similar time frame to acquire static cued measurements) and that provides significantly more information than a static measurement; and because the background response is embedded in the measurement, no dedicated background measurement is required. Additionally, the dynamic-cued survey obviates the need for re-shots due to poor sensor positioning since the dynamic sensor will provide a complete map of the area adjacent to the target location.
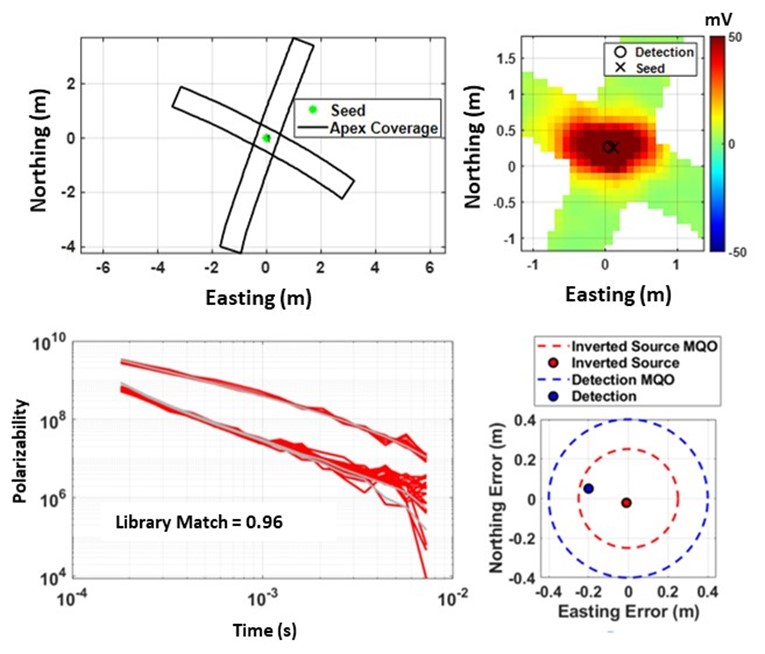
We validated this approach for dynamic-cued reacquisition as part of the APEX hardware demonstration of capabilities conducted at the Aberdeen Proving Ground last year. While dynamic “one-pass” surveys provide high confidence decisions on the majority of targets encountered, the dynamic-cued reacquisition of a small subset of these targets may provide additional confidence in the classification decision. Figure 3 shows an example of dynamic-cued data outputs associated with the reacquisition of a target.
Dynamic AGC: Examples from Production Operations
Starting in 2019, in collaboration with a European partner, we employed APEX for numerous dynamic AGC surveys (both one-pass and cued) at sites including farmland, airbases, and urban streets and sidewalks. TOI have varied from items as small as 20 mm projectiles to as large as 1000 lb bombs, depending on the specific site requirements. Prior surveys with conventional DGM or magnetometer systems at several of these sites indicated large numbers of anomalies were present. Using APEX for dynamic classification at these sites, we were able to greatly reduce the number of excavations required (Figure 4). A one-pass survey conducted in 2020, with targets of interest including UXO 105 mm in diameter or smaller and a project clearance depth of 1 m, resulted in the detection of 1851 anomalies across a 3-acre survey area. Anomaly classification reduced the number of required excavations from 1851 to 39, a reduction in excavations greater than 97%.
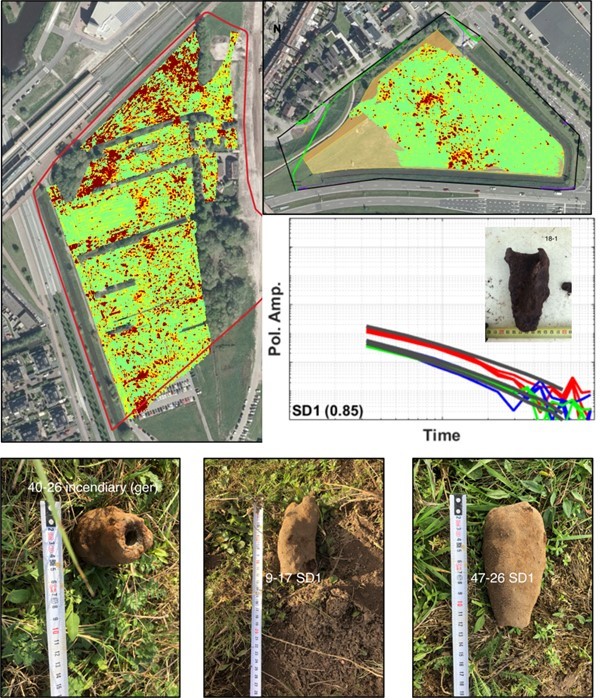
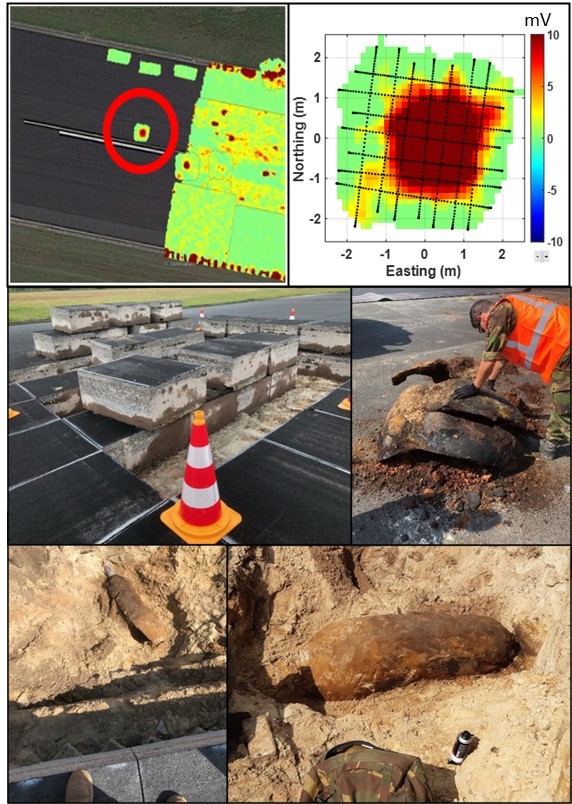
The APEX has also been employed at multiple airbases in Europe. At one airbase, the TOI were bombs 250 lbs and larger. These large bombs contain chemical sensitive fuses with the potential of detonation when exposed to vibration. The potential for vibrations from future use of construction equipment at the airbase necessitates the removal of all large bombs. Due to the great expense of excavating beneath a 75 cm thick runway, dynamic one-pass and dynamic-cued surveys were performed to reduce intrusive investigation. Dynamic one-pass surveys were performed over large sections of runway that prior DGM and magnetometer surveys had found to be uninterpretable due to high target densities. Dynamic-cued surveys were also performed over anomaly locations provided by magnetometer, DGM, and ground penetrating radar. The final APEX dig list produced for the highest priority section of the runway contained seven items for excavation. Excavation results found bombs or bomb-related items (bomb tails, large pieces of bomb fragmentation, etc.) in five of the seven dig locations (Figure 5).
Dynamic AGC: The Takeaway
The cost benefits of AGC for production UXO clean-up continue to improve. AGC technology development has evolved from a focus on improving classification methods to improving the efficiency with which those methods are applied. The diversity of project objectives (e.g., remedial investigation, removal action, third-party validation seeding, etc.) and site challenges means that there is no one-size-fits-all approach to AGC operations. Just as different sensor form factors are required to suit the needs of different sites (e.g., push-cart, litter, hand-held, towed array), it may very well be the case that different survey methods are required to suit the needs of different projects. Dynamic AGC, including the hybrid one-pass and cued approach, is certainly a valuable tool in the AGC toolbox.
Author Bios

Jonathan Miller
White River Technologies, Inc.
115 Etna Road, Bldg. 3 Ste 1
Lebanon, New Hampshire 03766
miller@whiterivertech.com
Jonathan Miller is a Senior Engineer at White River Technologies. He obtained a B.S. degree in Physics from Bates College and an M.S. degree in Mechanical Engineering from the University of Vermont. His research interests include application of magnetic and electromagnetic sensing to detection, subsurface characterization, and infrastructure monitoring. He is currently performing several projects involving integration of these sensor modalities with airborne and undersea platforms. Mr. Miller also serves as a Project Geophysicist on Advanced Geophysical Classification projects for TPMC-WRT under their ISO 17025 quality program.

Gregory Schultz, Ph.D.
White River Technologies, Inc.
115 Etna Road, Bldg. 3 Ste 1
Lebanon, New Hampshire 03766
schultz@whiterivertech.com
Dr. Schultz is the Chief Technology Officer at White River Technologies, Inc. and Principal Investigator for geophysical system DOD research and development programs such as the ESTCP project MR19-5212. He has 18 years of experience with autonomous sensing, geophysical data processing and inversion, simulation, and implementation of miniaturized magnetometers in ordnance clearance, infrastructure, and environmental applications. Schultz is an FAA-licensed drone pilot specializing in autonomous remote sensing. He is leading multiple efforts to integrate advanced magnetometer and electromagnetic sensor payloads on a variety of unmanned systems including autonomous fixed wing and rotary aircraft and autonomous underwater systems.

Joe Keranen
White River Technologies, Inc.
115 Etna Road, Bldg. 3 Ste 1
Lebanon, New Hampshire 03766
keranen@whiterivertech.com
Joe Keranen is a Senior Research and Development Scientist at White River Technologies. He obtained a B.S. in Electrical Engineering from Michigan State University and an M.S. in Acoustics from Pennsylvania State University. His focus is on development of UXO detection, estimation, and classification algorithms as well as advanced munitions sensing and multi-sensor data fusion approaches. Mr. Keranen’s current work involves the development and application of expert analysis software that allows for full exploitation of advanced detection and classification sensors for production UXO site remediation. He has also worked to demonstrate the potential for productivity increases that could be realized by incorporating this advanced technology as part of production protocol.
Fridon Shubitidze, Ph.D.
White River Technologies, Inc.
115 Etna Road, Bldg. 3 Ste 1
Lebanon, New Hampshire 03766
shubitidze@whiterivertech.com
Fridon Shubitidzeis a Senior Research Physicist at White River Technologies and a Research Professor with the Thayer School of Engineering, Dartmouth College, Hanover, NH. He received the degree of Diploma radio physicist (M.S.) from the Sukhumi branch of Tbilisi State University (TSU), Sukhumi, Republic of Georgia, in 1994 and the Cand.Sci. (Ph.D.) degree in radio physics (applied electromagnetics) from TSU in 1997. His current work interests focus on development of advanced EM sensing technologies (from 0 Hz up to GHz) for detecting and classifying buried explosive hazards on land and in underwater environments. In 2011, Dr. Shubitidze and his group received the Munitions Response Project-of-the-Year Award given by the Strategic Environmental Research and Development Program for developing and demonstrating advanced EMI models and algorithms for UXO detection and classification.

Jack Foley, Ph.D.
White River Technologies, Inc.
115 Etna Road, Bldg. 3 Ste 1
Lebanon, New Hampshire 03766
foley@whiterivertech.com
Jack Foley, Ph.D. is the Vice President of Operations at White River Technologies (WRT), an experienced Program Manager, and a subject matter expert in geophysical systems development and deployment. Since leaving MIT in 1990, Dr. Foley has been focused on munitions detection applications, developing and implementing several practical and advanced UXO, landmine, and IED detection technologies. Dr. Foley has worked on all aspects of detection and classification, including sensor development, system engineering, positioning technologies, platform integration, data acquisition, analytical and empirical classification techniques, and GIS / information technology integration. Dr. Foley has deployed these technologies on over 300 sites and published or presented over 75 papers in this topic area.
