
By Ronald Koomans1 and Han Limburg1
1Medusa Explorations BV
Introduction
There has been a boom in the use of drones for geophysical survey projects during the last couple of years. Not so much as a replacement for traditional (manned) airborne surveys but more as a replacement for walking or vehicle-borne surveys.
As a consequence, geophysical instrumentation is rapidly becoming adapted for drone-use. This “dronification” of geophysical equipment poses several technical challenges, as the equipment needs to get smaller in size and weight and energy-use needs to be minimized. Some of the technologies in the geophysicist’s toolbox can be used under drones without too much adaptation. Others, like gamma-ray survey systems, impose much more of a challenge as these systems tend to be relatively bulky, especially if the systems were originally designed for traditional airborne applications.
Gamma-ray spectrometry
Gamma-ray spectrometry has a long tradition as a geophysical tool for mapping soil and sediment properties. All rocks, soils and sediments contain tiny but measurable traces of potassium (40K), uranium (238U) and thorium (232Th), and the radiation emitted by these radionuclides carries information on the minerals the rocks and soils are made of. This phenomenon is used for instance in oil and gas and mineral prospecting to get a qualitative image of the mineral composition of an area or rock matrix. The research that started in the 1990’s at the University of Groningen (NL) has helped to quantify this phenomenon. It was found that several soil and sediment properties can be predicted with a high degree of accuracy by their radionuclide content. In other words, radionuclide concentrations form a ‘radiometric fingerprint’ of the soils under study (Meijer, 1998; van der Graaf et al., 2007) and this fingerprint can be used to translate the radionuclide concentrations into the soil property under study.
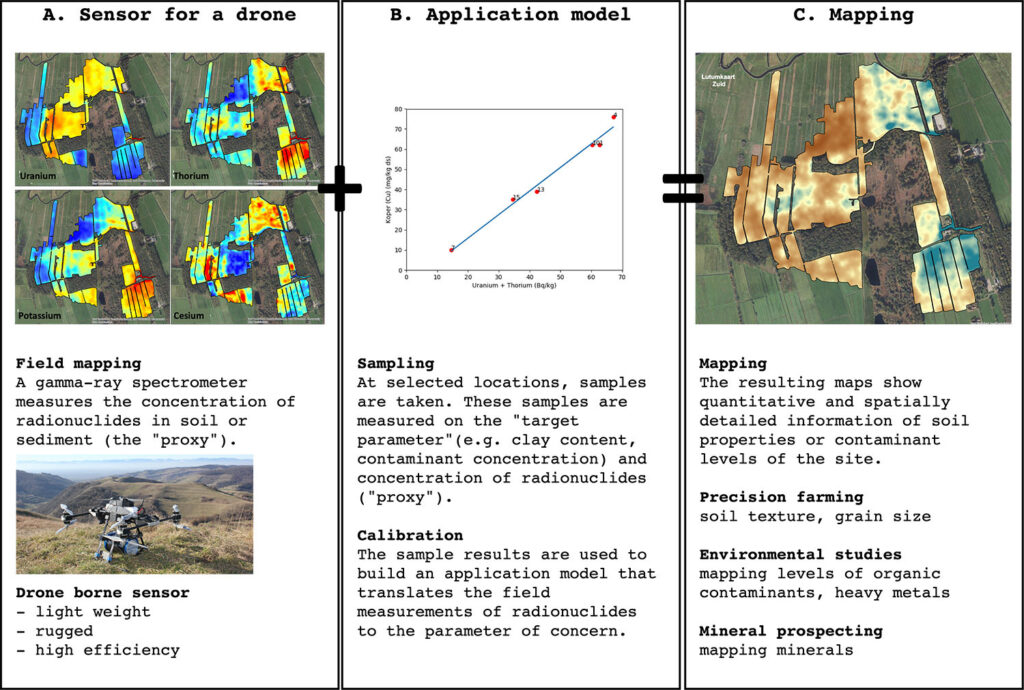
Figure 1: the 3-step approach for sensor-based mapping, the application model to a map that can be used by an end-user.
Spectral gamma-ray tools
Spectral Gamma-ray (SGR) sensors are devices that record the energy distribution of gamma radiation. This gamma radiation is a highly energetic form of electromagnetic waves emitted by radioactive sources like the natural ones mentioned above, but also by man-made sources like 137Cs (cesium) and 60Co (cobalt). Most SGR sensors used for geophysical work are made from so-called scintillator crystals, highly transparent materials that emit a light flash when radiation enters the crystal. The amount of light generated is proportional to the radiation energy recorded by an optical device and then translated into a radiation spectrum.
It is important to note that, in contrast to many other geophysical technologies, SGR tools are passive tools. They do not emit radiation, but just capture it. The capture probability, and thereby the detection efficiency, is directly proportional to the volume of the detector. The bigger the detector, the better the efficiency. This is the reason for using the large, multi-crystal detector “packs” in airborne surveying; the commonly used 80kg, 16liter packs just captures more radiation than a small 3x3inch handheld detector.
Using gamma-ray spectrometry in geophysics
The schematization in Figure 1 describes how SGR systems are used for mapping soil properties for precision farming, environmental studies and mining. This 3-step approach: using a proper sensor, finding an application model and the final mapping is described in the present paper.
A sensor for a drone
The real challenge in using an SGR under a drone is the limited payload of the platform. Although there is a large variety of drones available nowadays, all of them (except for some very exotic and expensive types) have a limited payload capacity which for most practical purposes does not exceed 10-15 kg. This has to do with legislation. In most countries, drones with a total weight lower than 25kg can be used with a straightforward RPL (Remote Pilot License).
Such payload limits imply a drastic reduction in allowable weight of a drone-borne SGR system. “Drastic” meaning a reduction of at least a factor of 10 compared to the 80-100kg weight of “classic” 4x4L NaI systems that are used in manned airborne surveys. The question arises: Is it possible to obtain reasonable survey results with such a small detector? We will show that it is possible by optimizing the size, shape and crystal type and by optimizing data processing such that it squeezes out every last piece of information out of the spectral data acquired.
The optimum sensor: a matter of proper size, shape, and crystal type?
To overcome the weight limits sketched above and achieve a weight reduction of a factor of 10, one should very carefully investigate and optimize the optimum size, shape and crystal type to be used.
The current availability of efficient detector modelling software allows for a rapidly converging detector design process. with a nuclear particle tracing code like MCNP (Waters et al., 2007), studied large numbers of detector sizes, shapes and crystal types on their effectiveness of capturing radiation in a drone-borne scenario. NaI is the most commonly used detector material but there are alternatives. CsI, and BGO have a higher density which positively affects the detection efficiency. Moreover, CsI has a few physical properties (unbreakable, highly temperature stable) that make it a favorable crystal type to use in many geophysical applications, especially in drone-borne operations where ruggedness is an important quality.
The table below shows a comparison of some of the readily available detector types that we studied. Key in the comparison is the sensitivity per kg detector material, which is used to find the optimum sensor for a given payload drone.
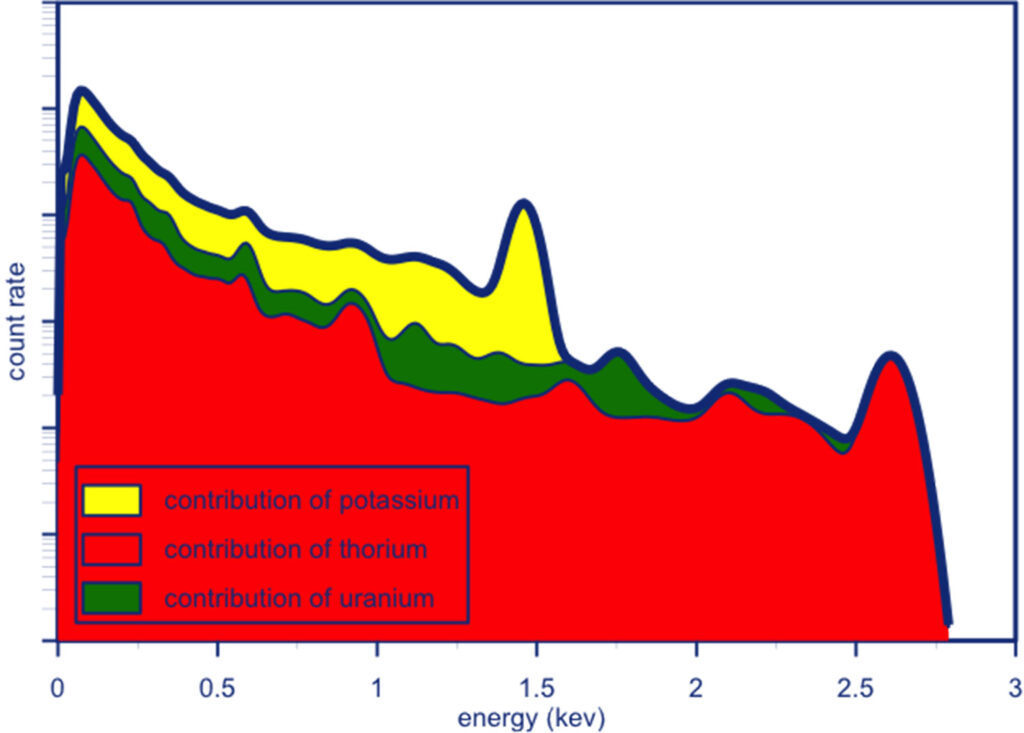
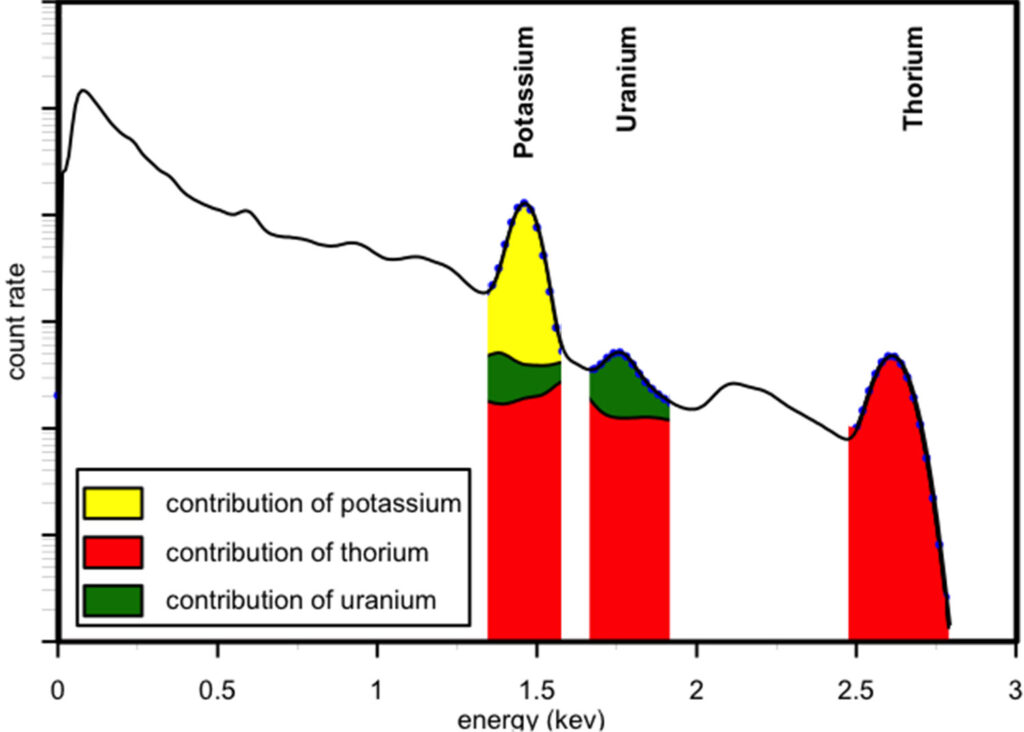
Figure 2. In the windows approach of data analysis, only part of the measured data is used (top). In the FSA approach (bottom), all data is used and every last piece of information is squeezed out of the spectral data.
The comparison in Table 1 clearly demonstrates that the most sensitive detectors are the 3inch – 3.5inch diameter CsI crystals. These units outperform the classic 4x4L packed NaI packs by at least a factor 1.5! A comparison like the one presented here can help find the right detector for the job and the ability to run simulation codes like MCNP has become an invaluable asset for the system designer.
| Detector type | 5×6” BGO | 3×8.6” CsI | 3.5×6.5” CsI | 3.5×13” CsI | 4x4x16” CsI | 4x4L NaI Pack |
|---|---|---|---|---|---|---|
| Volume (ml) | 1931 | 996 | 1025 | 2050 | 4198 | 15992 |
| Crystal weight (kg) | 13.7 | 4.5 | 4.6 | 9.2 | 18.9 | 62.1 |
| Shape | cylinder | cylinder | cylinder | cylinder | cylinder | cylinder |
| Sensitivity (cps per ppm) | 46.4 | 26.4 | 25.6 | 50.4 | 79.2 | 224 |
| % in 2360 keV peak | 9.37% | 4.55% | 4.93% | 5.35% | 6.05% | 5% |
| Sensitivity per kg crystal material | 3.36 | 5.76 | 5.56 | 5.44 | 4.9 | 3.6 |
| Relative efficiency w.r.t. 4x4L NaI pack | 93% | 160% | 154% | 151% | 136% | 100% |
Optimizing spectral processing – FSA
A proper detector design in terms of shape and material is only one of the optimization paths towards lightweight but efficient detectors. The other route is via improved spectral fitting methods. The standard approach to retrieve radionuclide concentrations from gamma-ray spectra is using the windows- or 3-windows methods (“Guidelines for radioelement mapping using gamma ray spectrometry data,” 2003). In this method, the content of the most prominent 40K, 238U and 232Th peaks is used to extract concentrations. Drawback of the method is that only a small part of the spectral data is used for fitting (Figure 2).
In the past, several noise-reduction techniques were developed (Hovgaard and Grasty, 1997; Minty and Hovgaard, 2002) but little of the noise. The NASVD and MNF methods differ mainly in how they normalise the input spectra for noise before spectral component analysis. The purpose of this paper is to evaluate these methods in terms of both the accuracy and precision of the resultant noise-reduced spectra. We develop a methodology based on the use of a synthetic spectra dataset to result in the true spectrum channel count rates in the absence of noise. Techniques that are very efficient in improving overall data quality but are empirical by nature. A certain smoothness of the data is assumed and the methods the risk of cancelling genuine data as noise.
The concept of “Full Spectrum Analysis (FSA)”, however, does not stand this risk. Early papers by Grasty (Grasty et al., 1985) and later refined by Minty (Minty et al., 1998) already describe the possibility of using a much larger part of the gamma-ray spectrum in the fitting procedure. In FSA, virtually all energy channels of the gamma-ray spectrum are used to retrieve the radionuclide concentrations instead of just the 3 peaks in the Windows method. FSA, when properly implemented, can improve data quality by at least a factor of two (Hendriks et al., 2001). FSA more or less halves the uncertainties in the radionuclide concentrations with respect to the windows method. This implies that one could use a 4-times smaller detector with FSA and still obtain results with the same quality!
Flying low and slow
Apparently, proper detector design could yield a weight reduction of about 1.5 and proper data analysis could improve even a factor of 4. If combined, both approaches allow for sensors at least 6 times smaller to be used and still get comparable results as a classic 4x4L crystal pack. However, the main benefit of using drones comes in here: a drone can fly low and slow! Lowering survey elevation from the 80 m which is common in manned airborne surveys to a “drone survey height” of about 10m gives another big improvement in data quality. The layer of air at 80m absorbs almost 50% of the radiation, an effect which is virtually zero at 10m. Moreover, the ground spot that a sensor sees is much smaller at 10m yielding a much better spatial resolution of the data.
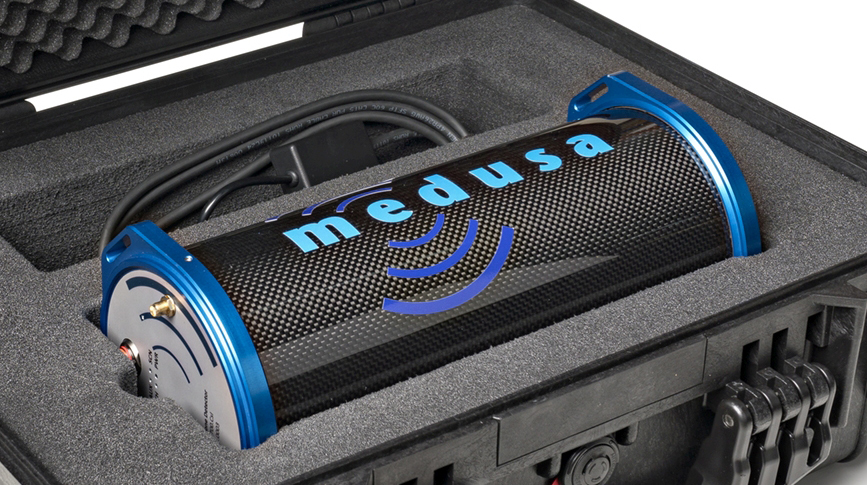
Figure 3. The MS-1000 Drone Detector is a low-power and robust gamma-ray detector system and, with a weight of 6.3 kg, is intended for use under UAV’s.
Following these considerations: optimized crystal type, size and shape, improved data analysis and flying low and slow, convinced us that drone-borne gamma ray spectrometric surveying is a viable option, even with detectors of weights of 7kg or even less. Figure 3 shows the Medusa-designed detector that we have found to be optimal for UAV-based radiometric surveying.
Application models
Application models are the models utilized to translate concentrations of radionuclides to the soil property or contaminant of interest. In this approach, the concentrations of radionuclides serve as a proxy for soil texture or contaminants levels. The gamma-ray spectrometer provides a direct measurement of concentrations of radionuclides. Most common are the concentrations of naturally occurring radionuclides (40K, 238U and 232Th) or other man-made radionuclides (or fission products) such as 137Cs. These measurements are the input for validated statistical models that correlate the concentrations of the radionuclides with the soil property or contaminant of interest. To be able to translate the field measurements into quantitative parameters such as clay content or contaminant level, it is of great importance that the field measurements provide quantitative and accurate results. A proper calibration of the sensor and the right choice of sensor (size suited for the application) is therefore a prerequisite.
The rationale behind the application models is illustrated below (Figure 4 and Figure 5). Soil is composed of particles with different size, shape and origin. Most soils are composed of sand, clay and organic matter. Each of these particles have radionuclides bound in their crystal structure or have absorbed radionuclides. The exact concentration of radionuclides per particle depends on the provenance and weathering of the minerals. In most climates, fine soil particles such as clay contain increased concentrations of natural occurring radionuclides (Wijngaarden et al., 2002). It is known that contaminants such as heavy metals and organic pollutants, when released into the natural aquatic environment, will bind to fine sediment particles (Moyo et al., 2014; Perk, 2006; Uddin, 2017) both in its natural and modified forms, effectively removing heavy metals from aqueous solution, as extensively discussed in this review. This detailed review compiles thorough literature of current research over the last ten years (2006–2016. The manner in which contaminants bind to the sediment particles depends upon the properties of the sediment (e.g. type of clay), properties of the chemical constituents and the concentrations of the chemical constituents. Therefore, a calibration model has to be determined for each site in which one of these properties differs.
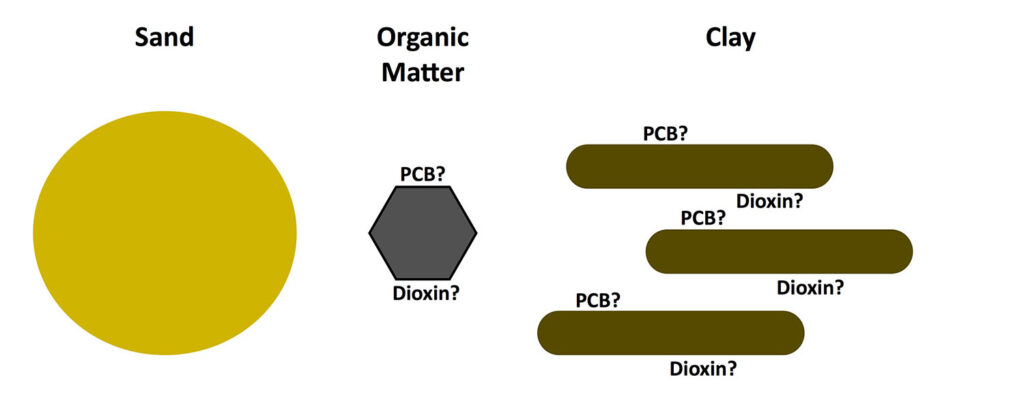
Figure 4: Soil is composed of particles with different chemical composition and different abilities to adsorb contaminants. This simplified schematic shows the relation between the concentration of the natural radionuclides (geochemical trace elements that can be measured in situ) and soil particles. The elements K, U, Th are mainly bound within the crystal structure of clay particles. The element U is more soluble and will, similar to other heavy metals, be adsorbed to the clay particles. Cs is an anthropogenic element and will adsorb onto clay and organic matter.
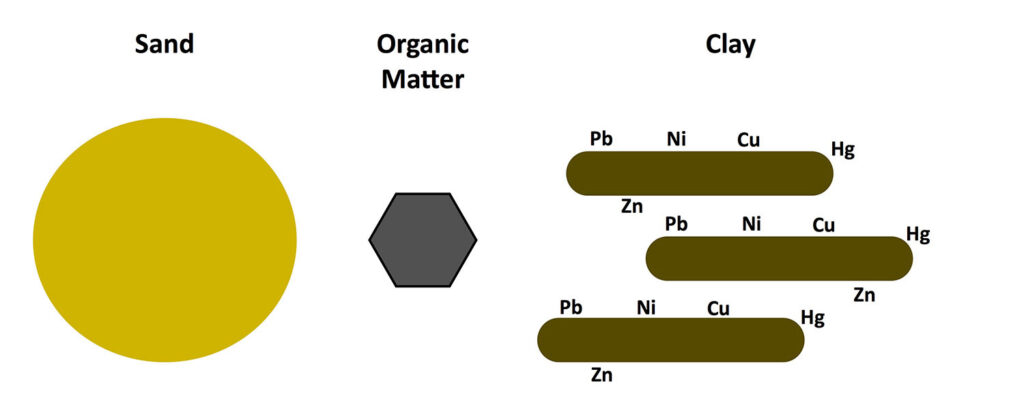
Figure 5: Top: organic pollutants that are diffusely distributed in the water column will mainly bind to clay particles and organic matter complexes (Uddin, 2017). Bottom: heavy metals mainly adsorb to clay particles (lower image). Scientific laboratory analyses are described in (van der Graaf et al., 2007). A review (Uddin, 2017) describes how “adsorption is one of the most important processes of metal uptake by clay”.
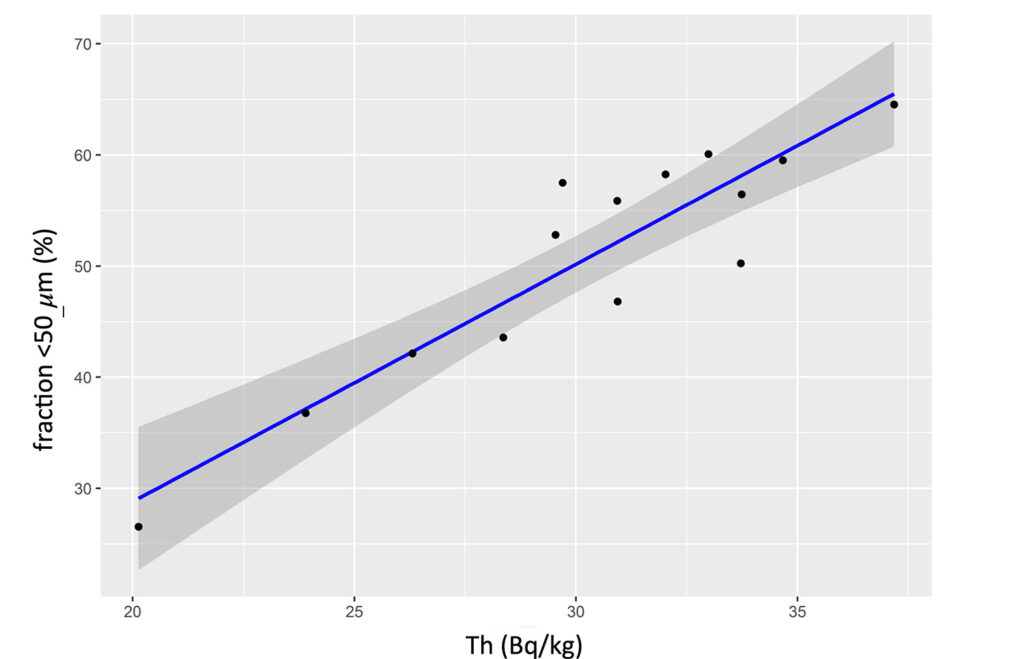
Figure 6: the application model that translates the thorium concentration (Bq/kg) into the clay fraction, defined as the grain size <50µm.
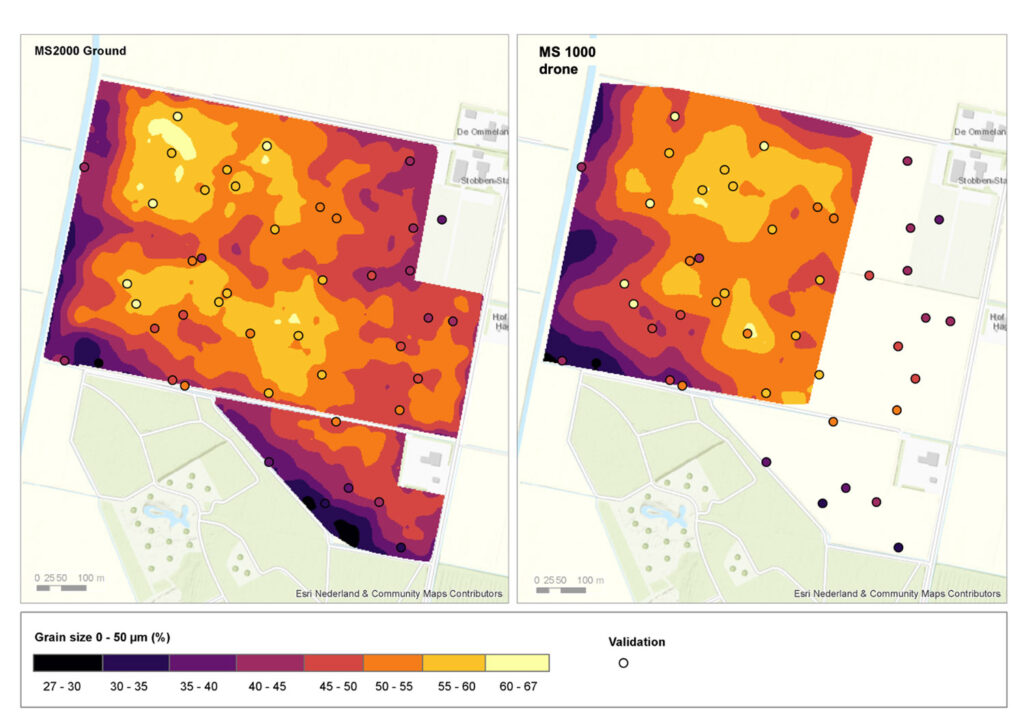
Figure 7: grain size map derived from a ground-borne survey (left) and an drone-borne survey (right).
Maps
Precision farming
Precision farming is more and more becoming an important tool in management of cropfields. In this concept, information on the clay content, grain size and water retention of agricultural fields helps farmers to improve the management of their fields. A gamma-ray spectrometer is a proven tool for mapping soil composition and the technique is often applied using a ground-borne vehicle as a tactor or ATV. However, after crop has been planted on the fields, access to the field is undesirable and the mapping is delayed until the harvesting season. The use of a drone can overcome this problem and gives the opportunity to map the fields for soil properties during the growing season.
To evaluate the quality of field mapping obtainable from a gamma-ray spectrometer mounted under a drone, we designed a comparison study for the prediction of physical soil properties of a meadow of 40 ha (8 fields) area in Flevoland, the Netherlands. In the project, measurements using a MS-2000 (a 2L crystal) sensor mounted on a tractor were compared with a drone-borne MS-1000 detector and to traditional soil samples (Egmond et al., 2018). The MS-1000 “Drone Detector” is a low-power, lightweight and robust gamma-ray detector system intended for use on UAV’s. The sensor is comprised of a 1L CsI scintillation crystal onboard electronics and has a weight of 7.7 kg. The MS-1000 was mounted under a standard, commercially available, drone (DJI M600 PRO). The drone was flying at an average elevation of 14 m with survey lines about 30 m apart. The data from the gamma spectrometer were analyzed using full spectrum analyses (Hendriks et al., 2001) with the Gamman software package and measurements were corrected for elevation of the drone.
To derive the application model, 14 soil samples were taken and analyzed in the lab on radionuclide content and clay fraction. The 232Th content shows excellent correlation with the fraction <50 µm (R2=84%, Figure 6) and was used to translate the field values of 232Th into a map showing the concentration of fines (<50 µm).
Figure 7 shows the resulting maps. Although the ground measurement and the drone data match relatively well, the spatial resolution of the data taken with the drone is less than the data taken walking. This is expected as the drone sees a larger radiation area and thereby has a larger footprint.
A separate set of 44 soil samples were taken and were used for independent statistical validation of the resulting maps. Sample locations were allocated using stratified random sampling. Using this data, we can compare the two gamma-ray measurements on their ability to predict physical soil properties, their footprint and accuracy. This analysis shows that the grain size values predicted from the measurements with the gamma-ray spectrometer correspond well to the validation samples. The Root Mean Squared Error (RMSE) of the ground borne map is 4%, whilst the RMSE of the drone borne map is 6% (Egmond et al., 2018). These values are small and demonstrates that the quality of the drone-borne map is up to par with the ground-borne survey and that both approaches are equally good for soil sampling.
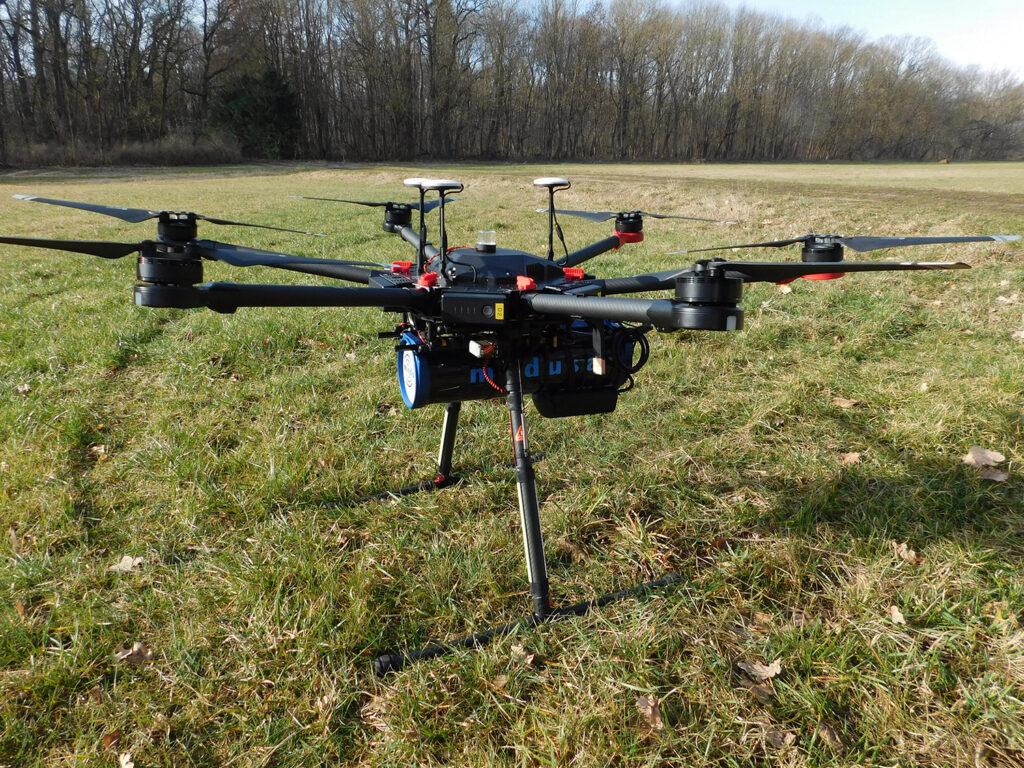
Figure 8: MS-1000 gamma spectrometer mounted under a standard commercial DJI M600 drone.
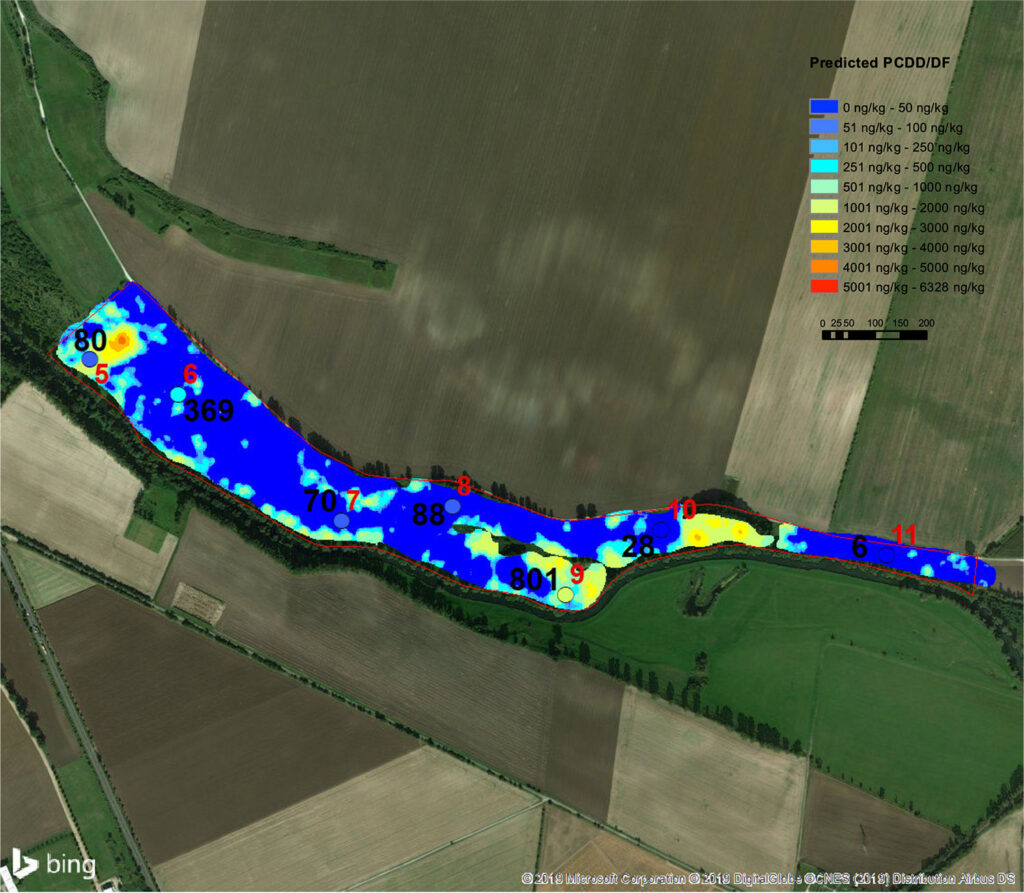
Figure 9: Dioxin concentrations of one of the fields of the floodplain. The points represent the sample locations and colours of the points are identical to the colours of the grid. The dioxin concentrations at these points were used to derive a % fines-dioxin relationship to convert the radiometrics derived % fines map to a dioxin concentration map.
Contamination of soils
Environmental contamination due to human activity is recognized as one of the modern dangers resulting from our industrial advancements. This contamination involves both organic contaminants and heavy metals due to historic releases at current and former industries. The contaminants can enter in the foodchain through uptake by the biota. Environmental restoration and closure of contaminated sites is a major priority.
The current approach to the management and monitoring of contaminated sites involves invasive, often labour-intensive, methods. This is particularly true when in the collection of samples to quantify and map the distribution of contaminants. As a result, the contours of the contaminant distribution based on the samples are subject to a number of potential errors resulting from sample size and inter-sample spacing, with the potential for ‘hot spots’ to remain unmapped.
Many contaminants are adsorbed to clay particles, especially in aquatic sediments. As a result, contaminant levels are strongly correlated to the composition of these sediments (when under water), or to the soil when the sediments are deposited on floodplains (Figure 5).
The Elbe River is one of the major rivers of Central Europe. It rises in the northern Czech Republic, traverses eastern and northern Germany before flowing into the North Sea northwest of Hamburg. Spittelwasser Creek is one of the tributaries of the Elbe River and has been the subject of numerous investigations dealing with the contamination of water, sediment, and soil in the Elebe River Basin. For many decades, waste water from the chemical industry located at the Bitterfeld-Wolfen site was discharged into Spittelwasser Creek. Large areas of the floodplains flowing into the basin were used as stacking basins for the heavily contaminated waste water during flood events. As a result, large amounts of contaminants released into the river systems were buffered in the aquatic sediments in the rivers and creeks and in the non-aquatic sediments of the floodplains. In this period, mostly organic chemicals were released increasing the levels of polychlorinated dibenzodioxins and furans (PCDD/F), hexachlorocyclohexane (HCH), and organotin compounds, impacting the water quality of the river still today (Jacobs et al., 2015).
To assess the contamination levels of the sediments on the three (3) plots located in the floodplains of this small river, a drone-borne mapping (with an MS-1000) was conducted. The MS-1000 was mounted under a DJI M600 drone (Figure 8). This drone is battery operated and has flight time with full load of 10-12 minutes. A dGPS antenna was connected to the sensor for measurement of the position. The drone flew at an elevation of 7m at a velocity of 3 m/s. The sensor had a sampling frequency of 1 Hz. The sensor was flown with 10 m spaced N-S flight lines and 10 m spaced E-W tie lines, 50 hectares were mapped in 3 days.
The drone-borne set-up was selected because some of the areas were difficult to access physically whilst for some areas, the landowners were not known and permits to physically access the land could not be acquired.
The results the survey were presented as maps of contaminant levels of the sediments (Figure 9). With this data, the government has detailed information about the contamination on a river-basin scale with which determine the proper remediation measures.
Summary & Conclusions
For several years, geophysicists have been dreaming about using drones for gamma-ray surveys (Stettler, 2015). This dream has become reality thanks to the innovation of highly optimized light-weight gamma-ray spectrometers. Devices that combine smart data processing with optimized detector design and choice of sensor material to arrive at small, efficient and rugged sensors.
Such sensors can now be applied routinely in drone-borne surveys, opening up a new range of applications as demonstrated in this paper for precision farming and environmental mapping.
Acknowledgements
The mapping projects described were conducted for Landesanstalt für Altlastenfreistellung (LAF) of Sachsen Anhalt, Germany and for Wageningen Environmental Research, the Netherlands.
References
Egmond, F.M. Van, Veeke, S. Van Der, Knotters, M., Koomans, R.L., Limburg, J., 2018. Mapping soil texture with a gamma-ray spectrometer: comparison between UAV and proximal measurements and traditional sampling. Wageningen, the Netherlands.
Grasty, R., Glynn, J., Grant, J., 1985. The analysis of multichannel airborne gamma-ray spectra. Geophysics 50, 2611–2620.
Guidelines for radioelement mapping using gamma ray spectrometry data, 2003.
Hendriks, P.H., Limburg, J., de Meijer, R.J., 2001. Full-spectrum analysis of natural gamma-ray spectra. J. Environ. Radioact. 53, 365–80.
Hovgaard, J., Grasty, R., 1997. Reducing statistical noise in airborne gamma-ray data through spectral component analysis. Proc. Explor. 753–764.
Jacobs, P., Schaffranka, E., Zauter, H., 2015. Organic contaminants in suspended particles, sediments, and loodplains of the Spittelwasser creek and the Mulde river with regard to their relevance in the Elbe river basin. Hydrol. und Wasserbewirtschaftung 59, 342–353.
Meijer, R. De, 1998. Heavy minerals: from Edelstein to Einstein. J. Geochemical Explor. 81–103.
Minty, B., Hovgaard, J., 2002. Reducing noise in gamma-ray spectrometry using spectral component analysis. Explor. Geophys. 33, 172–176.
Minty, B., McFadden, P., Kennett, B., 1998. Multichannel processing for airborne gamma-ray spectrometry. Geophysics 63, 1971–1985.
Moyo, F., Tandlich, R., Wilhelmi, B.S., Balaz, S., 2014. Sorption of Hydrophobic Organic Compounds on Natural Sorbents and Organoclays from Aqueous and Non-Aqueous Solutions : A Mini-Review. Int. J. Environ. Res. Public Health 11, 5020–5048. doi:10.3390/ijerph110505020
Perk, M. van der, 2006. Soil and Water Contamination From Molecular to Catchment Scale, 1st ed. Taylor &Amp; Francis Ltd.
Stettler, E., 2015. Dreaming about Drones, in: Breaking Barriers, SAGA 14th Biennial Geophysical Conference and Exhibition. SAGA 2015 keynote, Drakensberg, South Africa.
Uddin, M.K., 2017. A review on the adsorption of heavy metals by clay minerals, with special focus on the past decade. Chem. Eng. J. 308, 438–462. doi:10.1016/J.CEJ.2016.09.029
van der Graaf, E.R., Koomans, R.L., Limburg, J., de Vries, K., 2007. In situ radiometric mapping as a proxy of sediment contamination: assessment of the underlying geochemical and -physical principles. Appl. Radiat. Isot. 65, 619–33. doi:10.1016/j.apradiso.2006.11.004
van der Graaf, E.R., Limburg, J., Koomans, R.L., Tijs, M., 2011. Monte Carlo based calibration of scintillation detectors for laboratory and in situ gamma ray measurements. J. Environ. Radioact. 102, 270–82. doi:10.1016/j.jenvrad.2010.12.001
Waters, L.S., McKinney, G.W., Durkee, J.W., Fensin, M.L., Hendricks, J.S., James, M.R., Johns, R.C., Pelowitz, D.B., 2007. The MCNPX Monte Carlo radiation transport code, in: AIP Conference Proceedings. pp. 81–90.
Wijngaarden, M. Van, Venema, L.B., Meijer, R.J. De, Zwolsman, J.J.G., 2002. Radiometric sand – mud characterisation in the Rhine – Meuse estuary Part A . Fingerprinting. Geomorphology 43, 87–101.
Author Bios
Ronald Koomans studied geology at Utrecht University and finished a PhD at the nuclear physics lab of the University of Groningen on the application of an underwater gamma-ray spectrometer to study the transport of sediments in the coastal zone. Together with Han Limburg, Koomans founded Medusa Explorations in 2000. Both Limburg and Koomans have been working in the role of management, research and commercial projects since then. In the company, Ronald Koomans applies gamma-ray sensors for mapping properties of soil and sediment and is expert in developing application models for mapping grain size, texture and contamination of soils and sediments. ronald@medusa-online.com
Han Limburg studied physics at the University of Groningen and finished a PhD (cum laude) at the atomic physics group of the nuclear physics lab of the University of Groningen. After this PhD, Limburg worked at the nuclear physics lab on the commercialization of an underwater gamma-ray spectrometer. Together with Ronald Koomans, Han Limburg founded Medusa Explorations in 2000. Both Limburg and Koomans have been working in the role of management, research and commercial projects since then. In the company, Han Limburg focusses on the technical development by creating gamma-ray survey systems for geophysical applications by applying new detector materials and novel data analysis methods to make detectors smaller, more robust and user friendly. han@medusa-online.com
