
By Michael G. Baker 1 and Robert E. Abbott1
1Geophysics Department, Sandia National Laboratories, Albuquerque, New Mexico
Corresponding Author: Michael G. Baker (mgbaker@sandia.gov)
Published 11/17/2021
Abstract
Deployments of distributed acoustic sensing (DAS) along marine seafloors have successfully recorded a variety of environmental and anthropogenic wavefields propagating in the solid Earth and the open water column. DAS technology has several advantages over traditional ocean bottom seismometer arrays for seismoacoustic monitoring of ocean/Earth interactions, including higher spatial and temporal resolutions, environmental robustness, and real-time data retrieval. To evaluate the efficacy of DAS for continuous and in situ monitoring of polar environmental processes, we are collecting DAS data from a 40-km long section of seafloor telecommunications fiber located on the continental shelf of the Beaufort Sea, Alaska. This experiment will span eight, one-week, seasonally-distributed periods across two years and is a novel deployment of DAS to a polar marine environment; when complete, this may represent the longest, and first seasonally periodic, collection of marine seafloor DAS data. Here we present details of the experiment and some initial results from our first two data collects, under conditions of total and thawing sea ice coverage.
Introduction
Seismic analysis of near-surface environmental processes is an emerging focus of passive seismological research, facilitated by improvements over the past decade in instrumentation density, data processing techniques, computational power, and data storage. Studies in environmental seismology generally fall among two themes: 1) the detection and characterization of near-surface processes by way of their radiated seismic energy (e.g., landslides, shoaling ocean waves, ice quakes); and 2) the monitoring of near-surface structure by observing changes in seismic wave propagation caused by changing environmental conditions (e.g., erosion, saturation, thermal state) (Larose and others, 2015).
Seismology is particularly adept in polar coastal regions, where seasonal or long-term changes in ice content can dramatically alter source processes and seismic propagation on both land and water.
Offshore, the seasonal formation and breakup of sea ice is a strong modulator of interactions between ocean gravity waves and the solid Earth. Even first-year sea ice impedes the formation of high amplitude ocean gravity waves and ocean surf, a phenomenon observed on seismographs as a signification reduction in the power of the microseism wavefield (e.g., Baker and others, 2019). Sea ice also drastically affects the propagation of seismoacoustic waves in the water column and sea floor through the addition of floating elastic plate modes, (e.g., Crary, Lamb, and flexural-gravity waves), and strong intra-layer resonances. See Baker and others (2020) for a discussion of these phenomena in the context of ice shelves which is applicable to sea ice over shallow coastal waters such as the Beaufort Sea where the current study is sited.
Many grounded-ice processes are also observable with seismology. Glaciers, for example, advance under the forcing of gravity via a series of stick-slip basal icequakes, the rate of which may be governed by subglacial water pressure (e.g., Roeoesli and others, 2016; Gimbert and others, 2016). Subglacial rivers, as with all rivers, generate seismic noise with spectral content (i.e., power and frequency) that is characteristic of volume, velocity, and sediment load (Gimbert and others, 2016). Permafrost stability (or thawing) may be monitored at sub-weekly time scales by observing relative changes in the seismic velocities of ambient noise (James and others, 2019).
The goal of this study is to identify and characterize oceanic processes occurring in the shallow coastal waters of the Beaufort Sea, Alaska. To do so, we utilize a distributed acoustic sensor in conjunction with a transoceanic telecommunications fiber-optic cable that extends northward across the Alaska continental shelf. While many of these polar oceanic processes have been observed with traditional land-based or ocean bottom seismometers, this experiment is the first to employ distributed acoustic sensing in a polar marine environment.
Distributed Acoustic Sensing
Distributed acoustic sensing (DAS) is an emerging technology which utilizes buried fiber-optic cables to measure elastic strain in the surrounding Earth. The DAS interrogator injects pulsed laser energy into a fiber-optic cable and records Rayleigh backscatter from naturally occurring or engineered defects in the fiber glass. The pulses of returning laser energy may be integrated across temporal bins with arrival lags corresponding to discrete sections of the fiber. Compared across successive pulses, the interferometric phase of the reflected laser energy in each bin measures any changes in the time-of-flight through the associated fiber section as might be caused by axial strain of the optical fiber. In the simplest implementation of DAS, the delay between laser pulses must be at least equal to the two-way travel time of the pulse down the interrogated fiber; that is, the maximum possible sampling frequency decreases with the length of the fiber-optic cable. The exact parameters will vary by application, but seismological deployments of DAS typically sample at 1000 Hz or more over tens of kilometers, with spatial resolutions of 10 m or less. More rigorous discussions of DAS technology may be found in Mestayer and others (2011), Parker and others (2014), and Zhan (2020).
DAS technology offers a number of advantages in comparison to traditional seismometer arrays, particularly for applications of ocean bottom environmental seismology. The temporal and linear spatial resolutions possible with DAS may be several orders of magnitude greater than possible with an ocean bottom seismometer (OBS) array. For DAS experiments occupying unused (or “dark”) commercial telecommunication fiber (such as the present study), fiber location and orientation may be known with a high degree of precision as recorded during installation. In contrast, an OBS is typically at the mercy of ocean currents while traversing the water column during deployment and retrieval, requiring additional steps to determine orientation and positioning. Because only the cable termination point needs to be accessed, DAS deployments are logistically simpler and more affordable than OBS cruises, though the latter point may be offset by the high initial cost of the DAS interrogator itself.
DAS is not without its downsides, however. DAS is sensitive only to along-fiber strain or strain-rate, and therefore functions as an array of single-channel seismometers with wave-type dependent sensitivity nodes (Zhan, 2020). This significantly complicates the identification of wave particle motion and true velocity, in comparison to three-channel seismometers. These limitations may be offset by incorporating variable azimuths in the cable deployment, or by utilizing helically-wound fiber-optic cables. These options may not be available to experiments utilizing pre-existing dark fiber networks, however. Similarly, dark fiber experiments are restricted to regions with existing telecommunication infrastructure, and are further limited in range by any in-line telecommunications components which block propagation of the backscattered light. For example, the current experiment was limited by an optical repeater installed at 42 km along-fiber distance.
The CODAS Experiment
The Cryosphere/Ocean Distributed Acoustic Sensing (CODAS) experiment seeks to evaluate the effectiveness of DAS technology for in situ monitoring of polar coastal seismoacoustic signals, such as ocean-wave height and velocity, storm duration and severity, sea ice formation and breakup, and sea ice thickness. Biogenic signals (e.g. whale and seal vocalizations) and anthropogenic signals (e.g. surface shipping) may also be recorded.
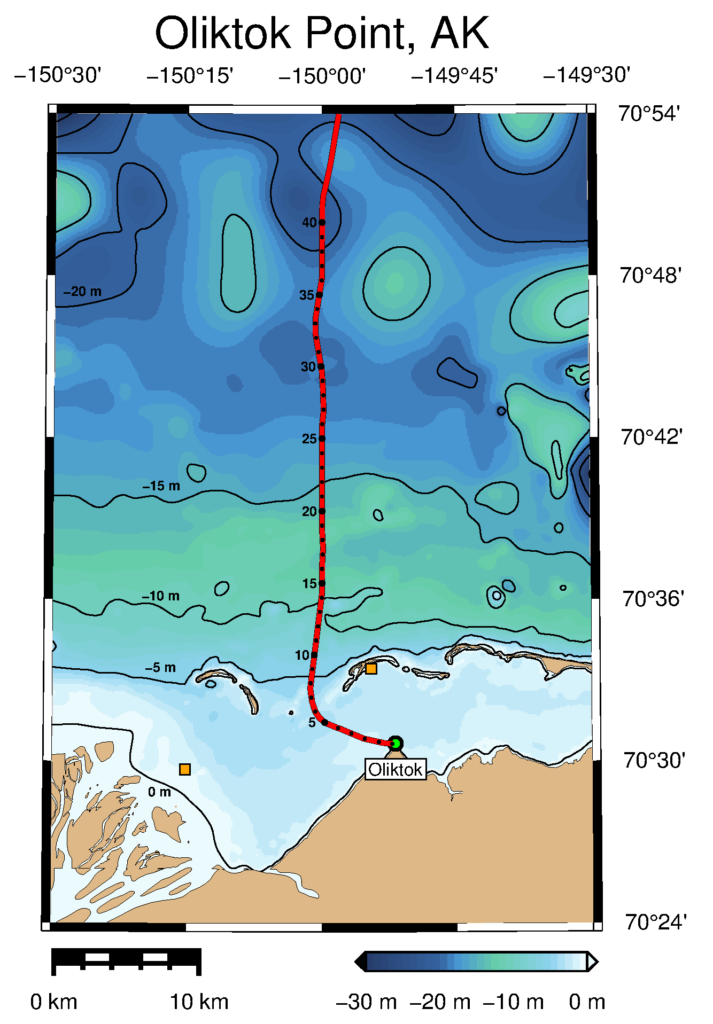
CODAS uses an existing seafloor telecommunications dark fiber (owned by Quintillion) originating at Oliktok Point, Alaska (Figure 1). For protection from scouring by pressure ridges, the fiber-optic cable was installed in a 4-m deep trench and backfilled. While this branch cable extends approximately 70 km into the Arctic ocean to join a trunk cable circumventing Alaska, an optical amplifier installed at 42 km is a hard limit for DAS recording.
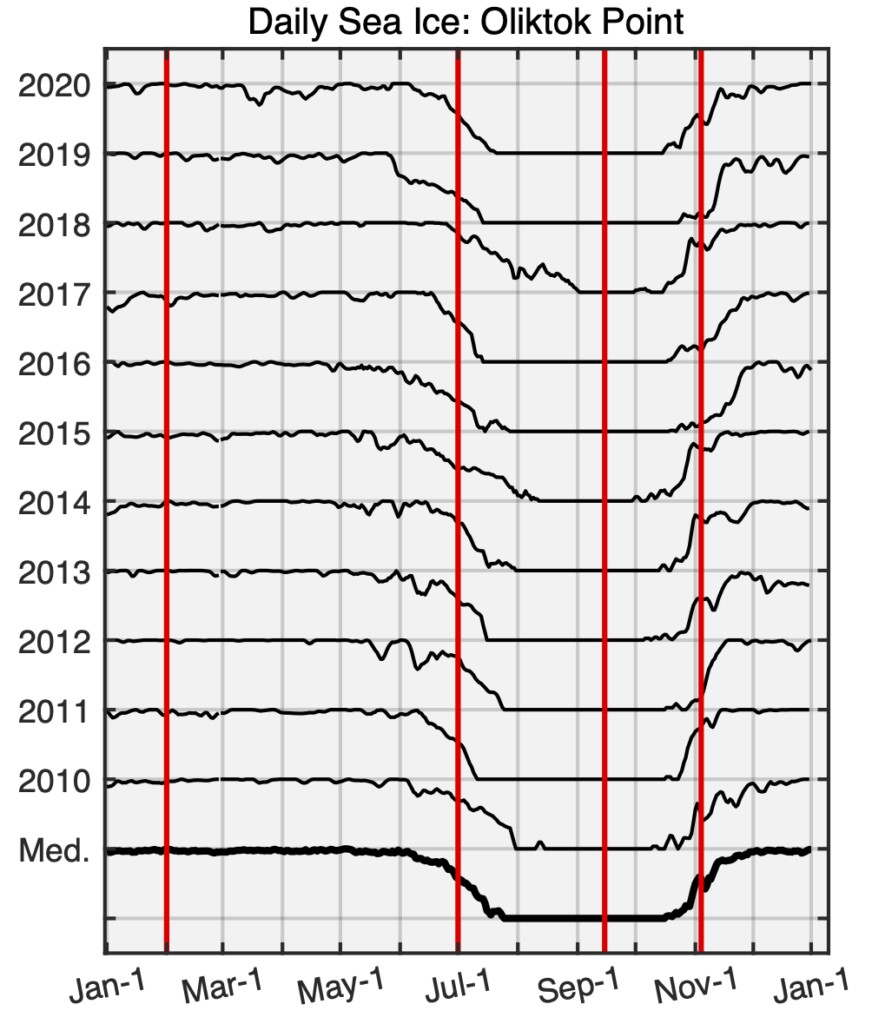
Eight one-week data collects will occur throughout 2021 and 2022 yielding two deployments during each Arctic “season” as defined by the state of Arctic ocean sea ice: i.e., ice-bound, ice-free, freezing, and thawing (Figure 2) (Cavalieri and others, 1996). The first of these deployments took place in Feb 2021 (ice-bound) and July 2021 (thawing) and will be discussed in the Results section.
The DAS parameters for the first two data collects were 10 m gauge length, 2 m spatial resolution, and 1000 Hz sample rate. We interrogated approximately 38 km of fiber, limited by signal-to-noise and the aforementioned amplifier. Each seven-day deployment records approximately 20 TB of data. All data collects are to be completed with a Silixa iDAS, owned by Sandia National Laboratories.
Notably, the fiber-optic cable utilizes a wide-core transoceanic fiber (Corning Vascade EX2000) which features an effective mode area that is approximately 35% larger than the standard single-mode fiber typically used in land-based telecommunication cables, based on manufacturer specifications. The impact of this wide-bore fiber on DAS data quality is currently unknown, but will be evaluated by future laboratory experiments.
Observations
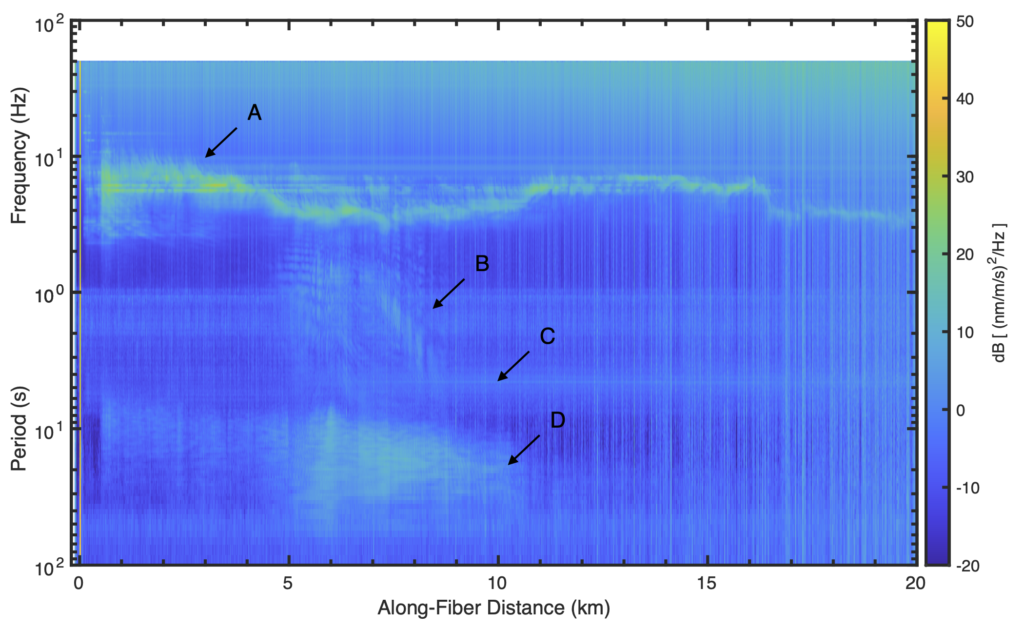
Figure 3. DAS PSDs with respect to along-fiber distance for February 3, 2021, 0800–0900 UTC (Winter, full sea ice coverage). PSDs were calculated as the mean of 500 s windows with 50% overlap. A) Unidentified, persistent, time-invariant, and distance modulated signal (0.1–0.3 s). B) Flexural-gravity waves from an unidentified near-field event (0.3–10 s). C) Secondary global microseisms (4–8 s). D) Wind-driven flexural-gravity waves (7–50 s).
At the time of this writing, we have completed two of our eight planned data collects. The “Winter” spanned February 2–8, 2021, and recorded under conditions of total sea ice coverage. The “Spring” spanned July 8–15, 2021, and recorded under conditions of partial coverage by thawing or fractional sea ice. Here, we present some initial observations and comparisons between the two datasets, and discuss the spectral signatures for identified environmental processes. Due to the volume of data already collected, and for brevity, we restrict this discussion to the first 20 km of fiber, downsampled to 100 Hz.
Figure 3 shows DAS power spectral density (PSD) with respect to along-fiber distance for a single hour recorded during the Winter (ice-bound) deployment. Background spectral power in the 0.02–100 s (50–0.01 Hz) range was generally uniform, apart from variations in channel response which are evident as vertical streaking. The 0.1–0.3 s (3–10 Hz) range was dominated by a relatively high power signal (>20 dB above ambient) that was time-invariant across the entire week of data and frequency modulated with along-fiber distance (Figure 3-A). The 0.3–10 s (0.1–2 Hz) band in the 0.5–20 km range was populated by a host of spectrally diverse, transient events (most lasting less than 300 s), with spatial extents ranging from hundreds of meters to 5 km (Figure 3-B). The 4–8 s (0.125–0.25 Hz) band was also characterized by elevated power which was time- and distance-invariant across the deployment (Figure 3-C). Finally, the 7–50 s (0.02–0.15 Hz) band in the 0.5–10 km range predominantly featured a signal that varied in power across multiple days and was otherwise spectrally consistent with time, but was modulated with distance (Figure 3d-D).
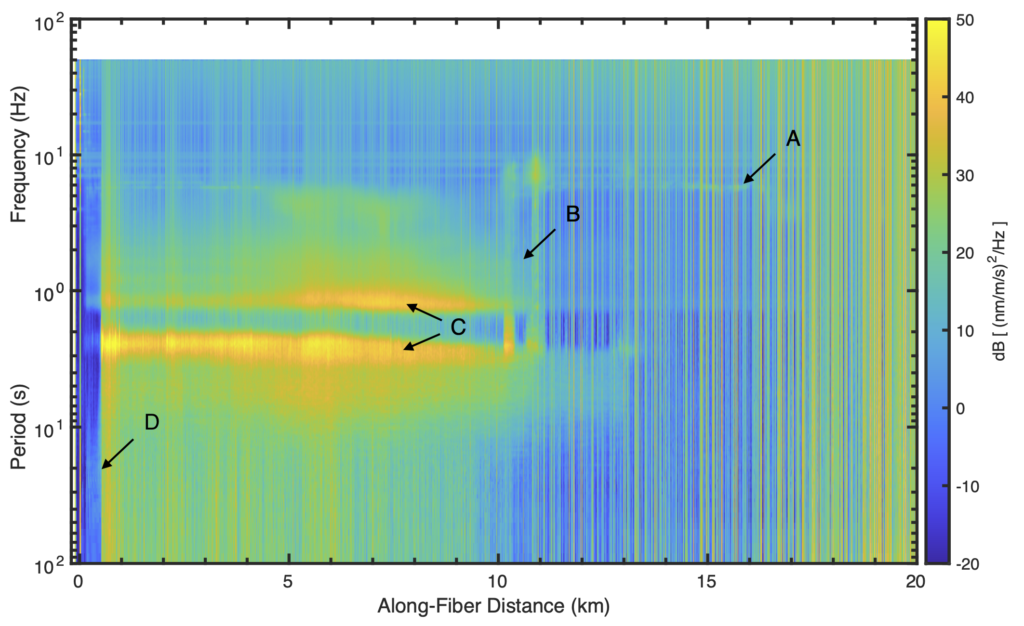
Figure 4 shows DAS power spectral density (PSD) with respect to along-fiber distance for a single hour recorded during the Spring (thawing) deployment. Background spectral power in the 0.02–100 s (50–0.01 Hz) range showed considerable variation with frequency and distance, with broadband increases in noise beyond 20 km. The 0.1–0.5 s ( 2–10 Hz) time-invariant signal observed during Winter (Figure 3-A) was mostly absent from the Spring deployment, except at distances of 14–17 km (Figure 4-A). Power in the 0.3–100 s (0.01–3 Hz) band is elevated in the 0.5–10 km range (Figure 4-B), with prominent peaks at 2.4 and 1.2 s (Figure 4-C). Power decreases by 30–40 dB for all frequencies at along-fiber distances less than 0.5 km (Figure 4-D).
Discussion
The time-series data used in Figure 3 are generally representative of the Winter deployment. Due to the recentness of the Spring deployment, we have not fully evaluated the Spring data and thus cannot comment on temporal variability or transient events. Based on in situ observations of near shore conditions, however, we do not expect much temporal variation in the predominant spectral features.
For Winter, the entirety of the study area was overlaid by approximately 1.75 m thick, first year sea ice (Laxon and others, 2013). For Spring, the sea ice was undergoing thermal and mechanical breakup, resulting in a several kilometer wide expanse of open water immediately offshore of Oliktok point (i.e., a coastal polynya). Translated to along-fiber distance, the first 10 km of fiber were beneath open water, while further distances observed fractional or continuous pack ice (MASIE, 2010). We attribute most of the observed differences between the Winter and Spring to these changes in sea ice.
The distance-modulated signal observed during Winter (Figure 3-A) remains unidentified. The signal’s relative strength during Winter and its absence during Spring except for in regions with surviving sea ice (Figure 4-A), suggests that it has an environmental component, rather than being a purely anthropogenic or instrumentation effect. One possibility is ambient noise resonances within seasonally frozen layers of the seafloor. Comparison to the 2022 Winter deployment may elucidate this phenomena.
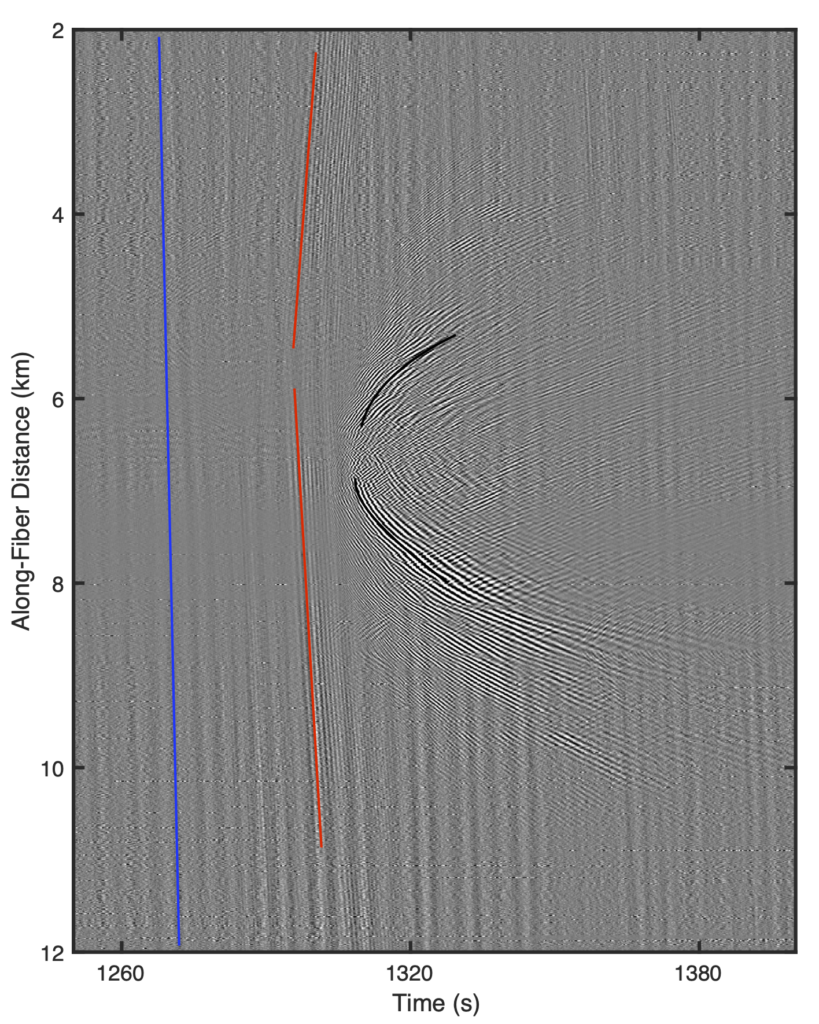
The transient events observed in the Winter 0.5–10 s (0.1–2 Hz) band (Figure 3-B) are likely indicative of a variety of cryoseismic and microseismic events. Cryoseisms may be caused by meteorologic or tidal forcings, and may be identified by their slow (<100 m/s), highly dispersive wavetrains of flexural-gravity waves. Solid Earth microseisms would likely be the result of local faulting or oil extraction at the nearby Spy Island and Oooguruk drill sites, and would be identified by their faster seafloor seismic phases. Figure 5 shows the time series for the unidentified event in Figure 3-B and highlights the flexural-gravity waves and a solid Earth phase. This event coincided with high tide and possibly originated at the sea ice grounding line at Spy Island.
Power in the Winter 4–8 s (0.125–0.25 Hz) band (Figure 3-C) is due to persistent, coherent wavetrains propagating roughly northward with apparent velocities of approximately 1.5 km/s (Figure 5). These are consistent with global secondary microseisms generated in the Gulf of Alaska (Aster and others, 2008). Primary microseisms are generally much weaker and are therefore likely occulted by locally-generated ambient noise.
Power in the Winter 7–50 s (0.02–0.15 Hz) band (Figure 3-D) correlates strongly with local wind speed. Initial frequency-wavenumber analysis of these waves yields dispersion curves consistent with locally generated, wind-driven flexural-gravity waves. This phenomena will be the topic of a future study.
For Spring, the decrease in broadband spectral power at 10 km (Figure 4-B) coincides with the edge of the coastal polynya (MASIE, 2010). The spectral peaks at 2.4 s and 1.2 s (Figure 4-C) are likely characteristic of wind sea (i.e., wind waves driven by local wind) excited within the coastal polynya. Whether these peaks are measurements of the hydrostatic pressure transients of the gravity waves themselves, or “primary” and “secondary” short-period microseisms, is unclear at this time.
At distances less than 0.5 km (Figure 4-D), the fiber-optic cable is enclosed in a large-bore conduit and is therefore poorly coupled to both the seafloor and water column. This decoupling is evident as the 30–40 dB drop in noise power at along-fiber distances less than 0.5 km. Nonetheless, we still observe spectral features that coincide with the known crossing locations of the shoreline and a hydrocarbon pipeline.
Conclusions
We deployed a distributed acoustic sensor to the Beaufort Sea, Alaska, for one week during conditions of total sea ice coverage, and for a second week under conditions of partial sea ice coverage during the spring thaw. Spectral characteristics of the observed seismoacoustic wavefields were markedly different between the two datasets. The Winter dataset features a variety of persistent and transient signals with dispersion curves indicative of flexural-gravity waves. The Spring dataset shows broadband excitation with prominent harmonic peaks at 2.4 and 1.2 s for along-fiber distances coinciding with the observed coastal polynya, which we interpret as seismoacoustic noise generated by wind sea. We feel that the efficacy and breadth of environmental signals observed by this novel deployment strongly support the continued development of DAS technology for continuous, in situ monitoring of polar coastal processes.
Acknowledgements
This work was supported by the Laboratory Directed Research and Development program at Sandia National Laboratories, a multimission laboratory managed and operated by National Technology and Engineering Solutions of Sandia LLC, a wholly owned subsidiary of Honeywell International Inc. for the U.S. Department of Energy’s National Nuclear Security Administration under contract DE-NA0003525. This paper describes objective technical results and analysis. Any subjective views or opinions that might be expressed in the paper do not necessarily represent the views of the U.S. Department of Energy or the United States Government. Bathymetry data were sourced from National Oceanic and Atmospheric Administration navigation charts US4AK7(L:K)(P:Q). The authors thank Quintillion for technical support and use of the Oliktok Point facilities, and Silixa for assistance in the field.
References
Baker, M.G., Aster, R.C., Anthony, R.E., Chaput, J., Wiens, D.A., Nyblade, A., Bromirski, P.D., Gerstoft, P. and Stephen, R.A., 2019. Seasonal and spatial variations in the ocean-coupled ambient wavefield of the Ross Ice Shelf. Journal of Glaciology, 65(254), pp. 912–925.
Baker, M.G., Aster, R.C., Wiens, D.A., Nyblade, A., Bromirski, P.D., Gerstoft, P. and Stephen, R.A., 2021. Teleseismic earthquake wavefields observed on the Ross Ice Shelf. Journal of Glaciology, 67(261), pp.58–74.
Cavalieri, D.J., Parkinson, C.L., Gloersen, P. and Zwally, H.J., 1996. Sea ice concentrations from Nimbus-7 SMMR and DMSP SSM/I-SSMIS passive microwave data. 2010-01-01 to 2020-12-31. Boulder, Colorado USA: NASA DAAC at the National Snow and Ice Data Center. doi: 10.5067/8GQ8LZQVL0VL. Accessed 2021-07-20.
Gimbert, F., Tsai, V.C., Amundson, J.M., Bartholomaus, T.C. and Walter, J.I., 2016. Subseasonal changes observed in subglacial channel pressure, size, and sediment transport. Geophysical Research Letters, 43(8), pp. 3786–3794.
James, S.R., Knox, H.A., Abbott, R.E., Panning, M.P. and Screaton, E.J., 2019. Insights into permafrost and seasonal active‐layer dynamics from ambient seismic noise monitoring. Journal of Geophysical Research: Earth Surface, 124(7), pp. 1798–1816.
Larose, E., Carrière, S., Voisin, C., Bottelin, P., Baillet, L., Guéguen, P., Walter, F., Jongmans, D., Guillier, B., Garambois, S. and Gimbert, F., 2015. Environmental seismology: What can we learn on earth surface processes with ambient noise? Journal of Applied Geophysics, 116, pp. 62–74.
Laxon, S.W., Giles, K.A., Ridout, A.L., Wingham, D.J., Willatt, R., Cullen, R., Kwok, R., Schweiger, A., Zhang, J., Haas, C. and Hendricks, S., 2013. CryoSat‐2 estimates of Arctic sea ice thickness and volume. Geophysical Research Letters, 40(4), pp. 732–737.
Mestayer, J., Cox, B., Wills, P., Kiyashchenko, D., Lopez, J., Costello, M., Bourne, S., Ugueto, G., Lupton, R., Solano, G. and Hill, D., 2011, Field trials of distributed acoustic sensing for geophysical monitoring. SEG technical program expanded abstracts, 2011, pp. 4253–4257.
Parker, T., Shatalin, S. and Farhadiroushan, M., 2014. Distributed Acoustic Sensing–a new tool for seismic applications. first break, 32(2).
Roeoesli, C., Helmstetter, A., Walter, F. and Kissling, E., 2016. Meltwater influences on deep stick‐slip icequakes near the base of the Greenland Ice Sheet. Journal of Geophysical Research: Earth Surface, 121(2), pp. 223–240.
U.S. National Ice Center and National Snow and Ice Data Center. Compiled by F. Fetterer, M. Savoie, S. Helfrich, and P. Clemente-Colón. 2010, updated daily. Multisensor Analyzed Sea Ice Extent – Northern Hemisphere (MASIE-NH), Version 1. 1 km resolution. 2021-07-08 to 2021-07-15. 70.5°N, 149.5°W; 70.9°N, 150.5°W. Boulder, Colorado USA. NSIDC: National Snow and Ice Data Center. doi: 10.7265/N5GT5K3K. Accessed 2021-07-20.
Zhan, Z., 2020. Distributed acoustic sensing turns fiber‐optic cables into sensitive seismic antennas. Seismological Research Letters, 91(1), pp. 1-15.
Bios
Robert E. Abbott (2001 PhD in Geophysics, University of Nevada) is a Distinguished Member of the Technical Staff in the Geophysics Department at Sandia National Laboratories. He primarily works in the field of explosion source phenomenology and nuclear nonproliferation, often involving large-scale experiments at the Nevada National Security Site. He also has led projects in Alaska focusing on permafrost characterization and using distributed acoustic sensing on the seafloor.
Michael G. Baker is a postdoctoral appointee in the Geophysics Department at Sandia National Laboratories, where he is researching the use of distributed acoustic sensing in polar coastal waters. His dissertation work concerned the elastic and gravitational wavefields of the Ross Ice Shelf, Antarctica. He holds a PhD in Geophysics from Colorado State University (2020) and a BS in Physics & Astronomy from Northern Arizona University (2003).
