
By Dan R. Glaser (Corresponding Author)1, R. Daniel Costley2, and Zoe Courville3
1 US Army ERDC Cold Regions Research & Engineering Laboratory, Hanover, New Hampshire, USA
2 US Army ERDC Geotechnical Structures Laboratory, Vicksburg, Mississippi, USA
3 US Army ERDC Cold Regions Research & Engineering Laboratory, Hanover, New Hampshire, USA
ABSTRACT
Among many notable effects of a warming climate is the immediate and dramatic impact of sea ice reduction, which can alter ranging extents of arctic land and marine animals. Predatory animals are thus forced to explore new areas in search of food, presenting a new risk to human life and health. In recent years, polar bears were found wandering into arctic research camps previously thought to be safe from such predators and ranging as far as 500 km inland from their typical coastal hunting grounds. One such occurrence at the National Science Foundation Summit Station research camp in the center of the Greenland ice sheet resulted in the pursuit of technologies that could provide early warning of approaching polar bears. In this preliminary feasibility study, we evaluate the use of fiber optic distributed acoustic sensing as a perimeter intrusion detection tool in arctic conditions. Specifically, where burial in snow and ice, rather than traditional ground materials is necessary for adequate coupling and subsequently, adequate sensing of approaching polar bears. We use humans as an analog for polar bears by calculating and comparing foot pressure in this initial study.
INTRODUCTION
Physical evidence of climate change manifests throughout the globe, but is most evident in the polar regions where warmer temperatures lead to diminished sea ice extent, glacial retreat, accelerated permafrost degradation, and heightened coastal erosion (Melvin and others, 2017). On August 14, 2021, rain was observed at Summit Station, a National Science Foundation (NSF) research camp in the center of the Greenland ice sheet (henceforth referred to as Summit Station). Rain lasted for several hours and the above freezing temperatures lasted for a total of 9 hours. This was the first reported rainfall event, in recorded history, at Summit Station. Other melt events, a result of temperatures above freezing, occurred in 1995, 2012, and 2019 but with no associated rainfall. Prior to 1995 the record relies solely on observed melt events in ice cores with the next most recent melt event occurring in the late 1800s (Scambos and others, 2021).
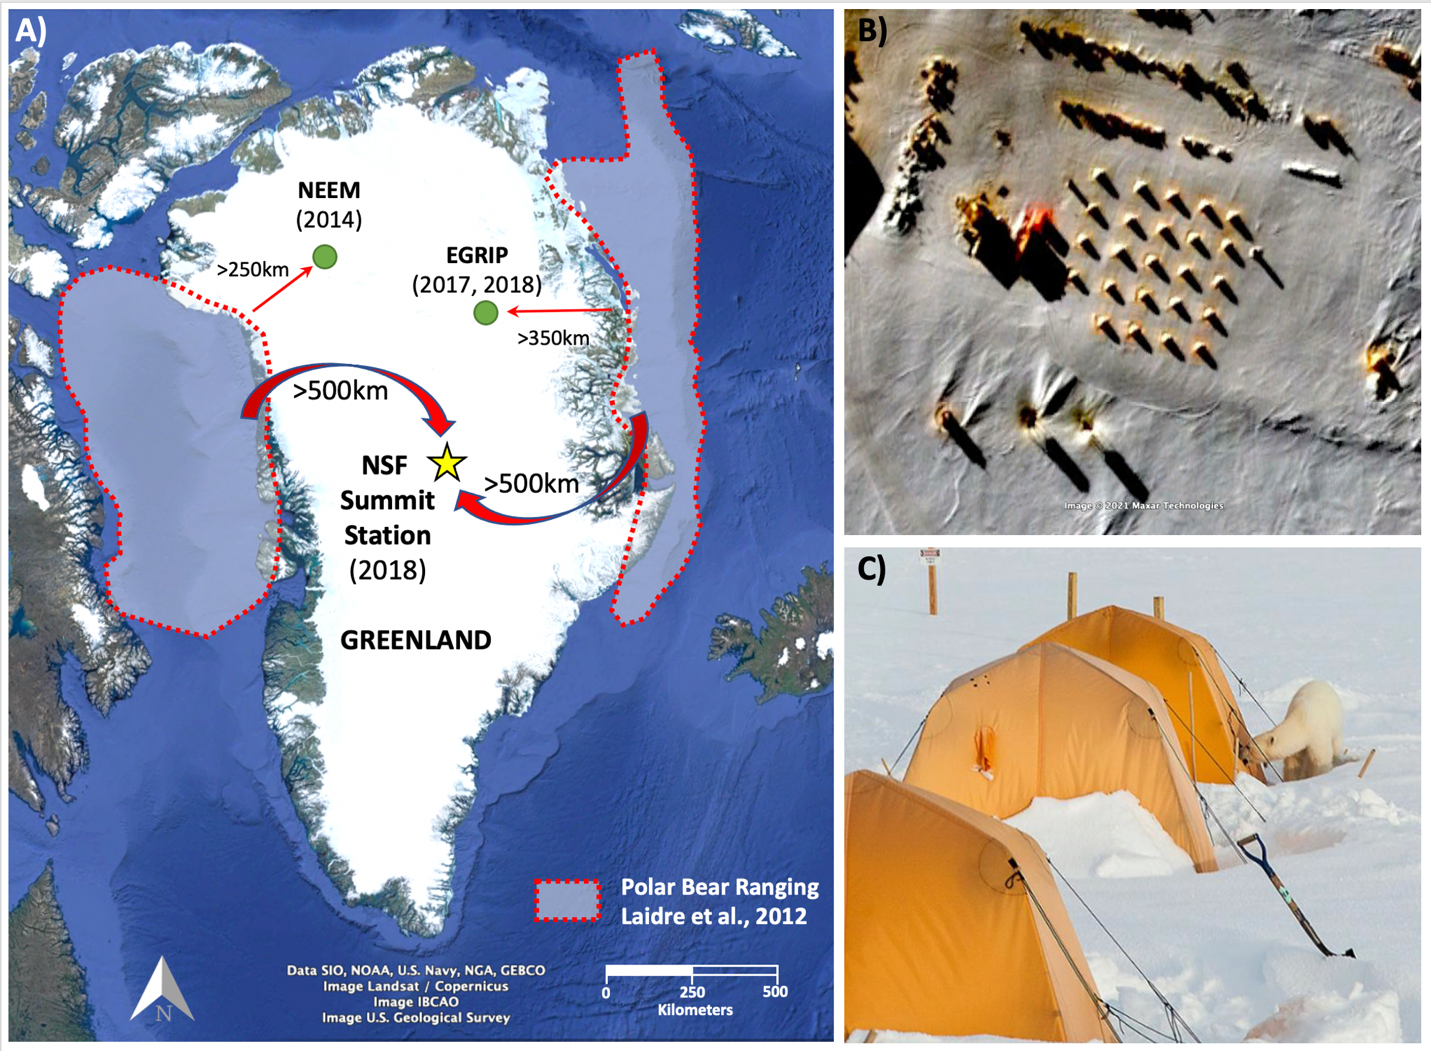
Much like temperatures in polar regions, polar bear encounters with humans are also on the rise (Pope, 2019; Sterling & Derocher, 2012). With continuously diminishing sea ice extent negatively impacting polar bear habitat, these encounters are expected to continue, threatening the health and safety of natives and researchers working in these regions, as well as the polar bears themselves. From 1870-2014 there were 73 confirmed polar bear attacks on humans, including 20 fatal attacks, with the greatest number of encounters occurring between 2010 and 2014 (Wilder and others, 2017). In 2014 a polar bear was sighted at the North Greenland Eemian Ice Drilling camp (NEEM), located in the northern part of the Greenland Ice Sheet (Figure 1). In 2017 and 2018, two separate incidences were occurred at the East Greenland Ice Core Project (EGRIP) camp, located to the northeast of Summit Station. Shortly after these encounters, the researchers at EGRIP turned to doppler radar in an attempt to establish an early warning system for polar bear detection. There was an especially notable encounter on June 24, 2018 at Summit Station, which is (Katz, 2018) more than 500 km from the coastal hunting grounds of the polar bears, representing the furthest inland these animals have been recorded. Figure 1 also indicates the breeding season extent of polar bears, where the breeding season was defined as March through May (Laidre and others, 2012). Where the occurrence at Summit Station was in June, this is further evidence of worsening habitat conditions as they continue to range farther in search of food. As a result of the polar bear encounter at Summit Station, action was taken early on including converting researchers’ lodging from flexible tents to rigid walled structures, as well as researching additional early warning systems for remote detection of polar bears.
One promising early warning system uses fiber optic distributed acoustic sensing (DAS) technology. DAS has a variety of uses including subsurface seismic imaging, seismic event detection, pipeline and facility intrusion detection, and above ground acoustic sensing (Hathaway and others, 2013; Costley and others, 2017, 2018; Ajo-Franklin and others, 2019). DAS can be optimized for intrusion detection through monitoring of subterranean seismic and acoustic vibrations, while assigning characteristic signatures for specific sources such as approaching vehicles, movement of people or animals, and even aircraft (Jousset and others, 2018; Ajo-Franklin and others, 2019; Peterson and others, 2020). In general, DAS senses and quantifies vibrations detected through back scattering of a class 4 laser due to incident contraction of the fiber sensor. In order for DAS to provide a useful signal-to-noise ratio (SNR), it is often buried within a half meter of the ground surface (coupled). The coupling with the soil reduces high-frequency acoustic and seismic noise due to wind or other ambient sources. Recent work has demonstrated the efficacy of single and three component DAS coils to enhance SNR in otherwise noisy environments (Peterson and others, 2020).
Installations in the extreme arctic environment offer many challenges over and above traditional deployments. At the center of the Greenland ice sheet, the ice thickness is nearly 3 km making it next to impossible to complete a traditional DAS installation in earth materials. Further, annual snowfall at Summit Station, up to 0.7 meters, poses an additional challenge, as additional snow pack will result in decreased SNR. This work seeks to evaluate DAS sensing fiber for use in extreme arctic conditions to investigate the possibility of direct snow-pack coupling, and to assess the sensitivity loss with increased snow overburden. Previously, Castongia and others (2017) demonstrated DAS coupling embedded in lake ice, and more recently, DAS has been coupled with snow in glaciated terrain in Antarctica for microseismicity studies (Walter and others, 2020; Hudson and others, 2021). We believe our research, conducted in the summer of 2019, was the first to demonstrate direct snow coupling of DAS. For this research, DAS was evaluated as an intrusion detection system in a controlled laboratory setting where fiber optic functionality was demonstrated down to -70 degrees Celsius (Phase I) and overall system functionality was demonstrated down to -40 degrees Celsius (Phase II). Humans were used to replicate polar bears walking near the sensor (Glaser et al, 2019).
This initial laboratory research is the first in a series of tests designed to assess the technology for perimeter detection in arctic conditions. Following the success of this laboratory study, a small-scale (1km sensing loop) field test will be executed at Greenland Summit Station in the summer of 2022.
DISTRIBUTED ACOUSTIC SENSING
In general DAS systems consist of two major components: 1) a long fiber optic cable and 2) a laser interrogator. The long fiber optic cable is often on the order of 5 km to 40km, while the laser interrogator analyzes a pair of light pulses from a narrow linewidth, high-coherence, near-IR laser and is injected into a fiber optic cable. As the pulse pair travels through the fiber, small packets of light are scattered back (backscattered) towards a receiver within the interrogator via a mechanism called Coherent Rayleigh (CR) scattering.
The backscattered light is sampled with a fast optical receiver at definite times corresponding to specific distances along the fiber. The interval between the two pulses corresponds to a segment of the fiber, referred to as the gauge length. In this case the gauge length was 2 m, but it can be as long as 10 m in some systems. A change in optical path length due to strain in the fiber produces a phase shift in the backscattered light. The sensor interrogator unit measures changes in optical phase of the backscatter light, and hence, small changes in optical path length of the sensor zone, which is proportional to strain. The interrogator converts these optical phase differences into time-series data. The repetition rate of the light pulses governs the sample rate of the sensor system, i.e., the change in strain in each segment is measured with each pulse. In this experiment, the interrogator was configured to have repetition rates of 2 kHz. The deformation in the snow caused by footfalls and other seismic events produces localized strains in the fiber, which are recorded temporally by the spatially sequential (i.e., “distributed”) segments in fiber (Hathaway and others, 2013; Costley and others, 2017; Miah and Potter, 2017; Costley and others, 2018).
EXPERIMENTAL DESIGN
This preliminary research consisted of two phases: 1) evaluate the functionality of fiber optic cable over the range of temperatures historically observed at Summit Station; and 2) evaluate the performance of a DAS installation coupled to snow and ice at temperatures equivalent those experienced at Summit Station. Phase II also included evaluation of likely foot pressures associated with a walking polar bear and the likely reduction in SNR associated with an increased snow pack overburden. Both phases of research were conducted at the US Army Corps of Engineers ERDC Cold Regions Research & Engineering Laboratory making use of their specialized cold chamber and cold room facilities. Phase I makes use of the MTS Systems cold chamber, a relatively small chamber with temperature capabilities down to -70oC, while Phase II makes use of a digitally controlled cold room manufactured by Cincinnati Subzero, USA, with temperature capabilities down to -40oC.
Phase I
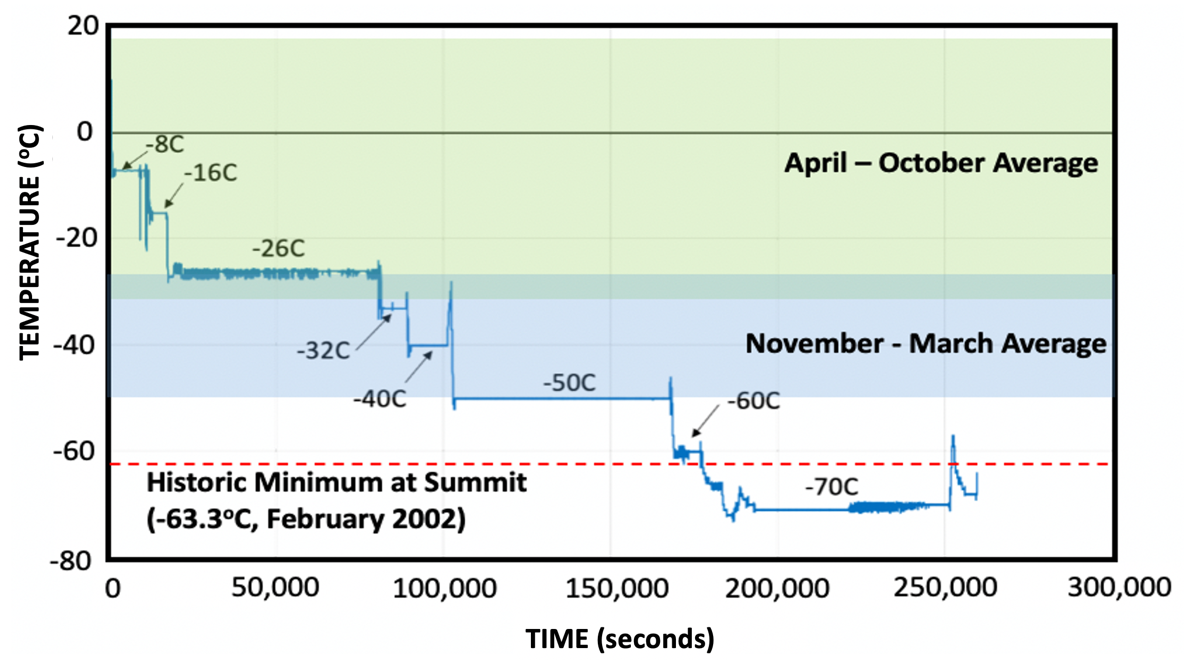
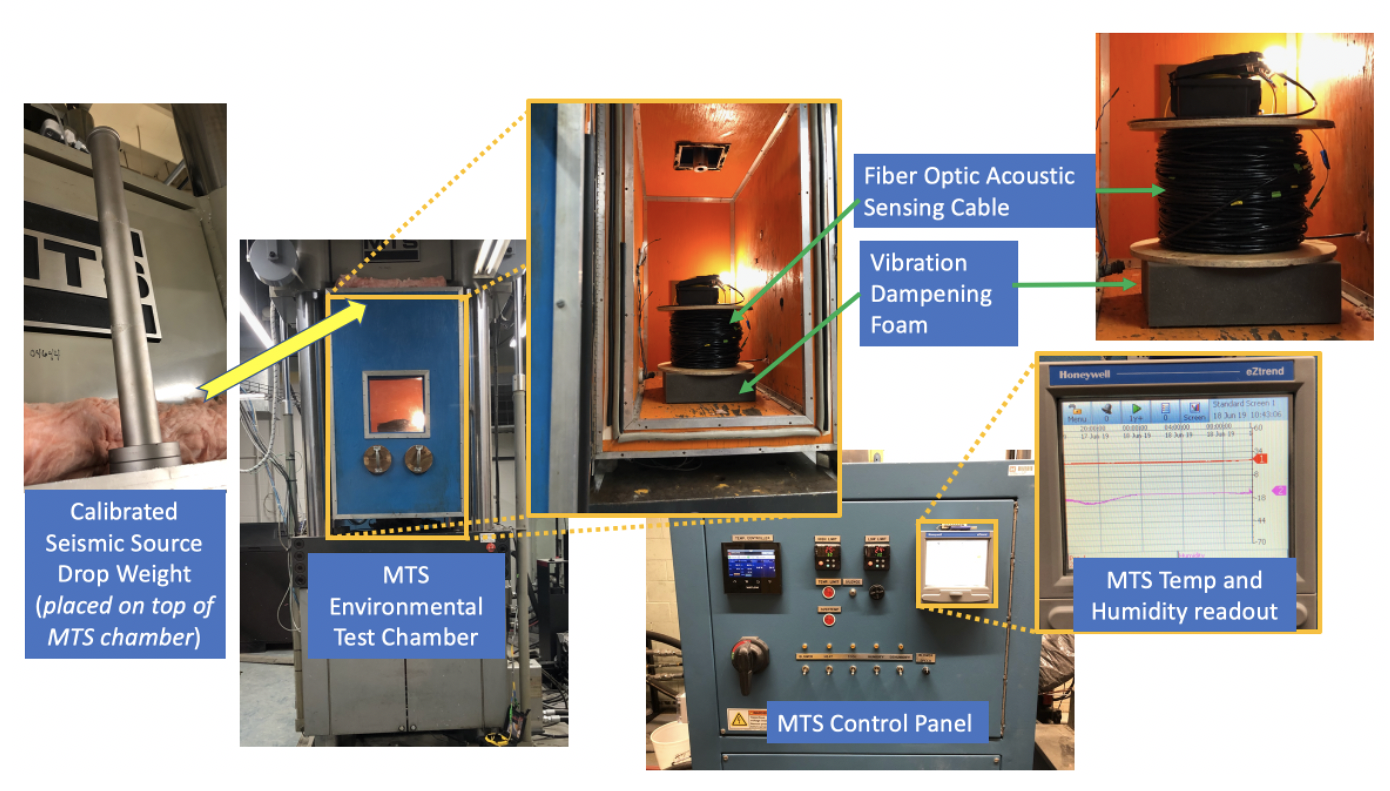
The Phase I work was conducted using a small MTS Systems environmental testing chamber. This small, cold box approximately 0.75 m x 1.0 m x 1.0 m allowed for consistent testing down to temperatures of -70°C. The phase I test was designed to evaluate the functionality of fiber at extreme temperatures. It was not intended to replicate field conditions other than the temperature, as such the fiber remained spooled. Data were acquired at eight different temperatures: -8, -16, -26, -32, -40, -50, -60, and -70°C (Figure 2). Ambient temperatures within the test cell were allowed to equilibrate for a minimum of 2 hours prior to measurement. In order for the system to be evaluated within the constraints of the available testing apparatuses, two 2.5 km launch boxes were used at either end of a 150 m DAS sensing cable. This provided a little over 5 km of fiber optic cable for the test. For both Phase I and Phase II tests, the system was configured with 2 m gauge lengths. One launch box and the coiled cable were included within the MTS Systems environmental chamber during testing. Both the cable and launch box were placed on a foam block to reduce vibrations associated with the MTS. A calibrated drop hammer was positioned on top of the test chamber as an acoustic and seismic source. A 190-gram weight was dropped from a height of 0.42 m. Three sets of three temporally spaced impacts were performed at each test temperature.
Phase II
This phase of testing was designed to evaluate the ability of the DAS fiber to sense seismic signatures at varying ambient temperatures between 0oC and -40oC and at varying depths within the snow column. As such, a snow test cell was designed and constructed that allowed for fiber sensor placement at four depths within the snow column. Further, as a seismic source we sought to mimic the signature of our eventual target, which in this case is the polar bear. To that end, we studied the basic mass, paw dimensions, and ambulatory characteristics of polar bears and related them to the same parameters in humans.
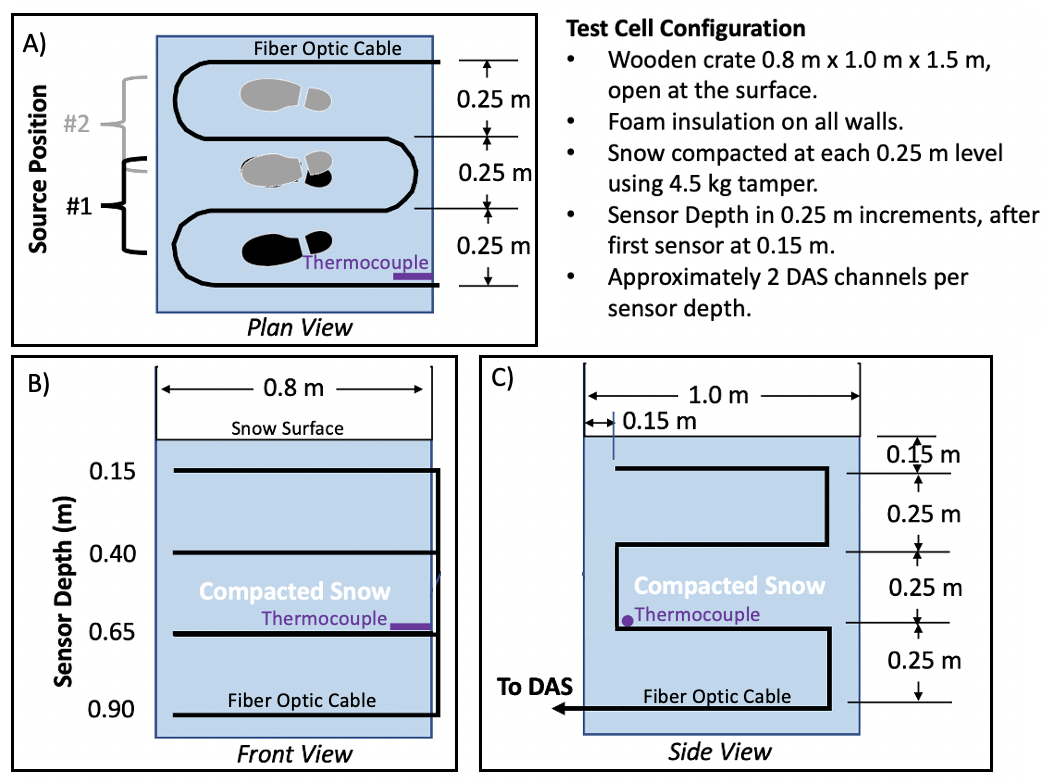
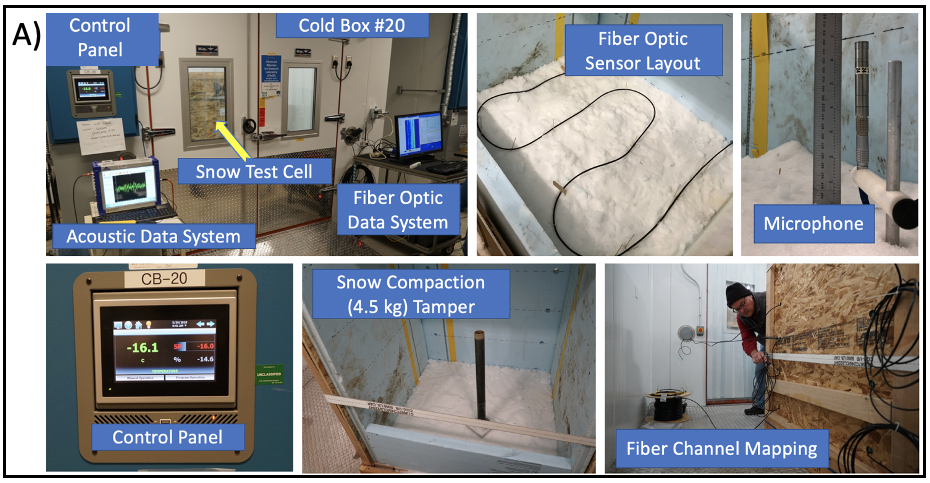
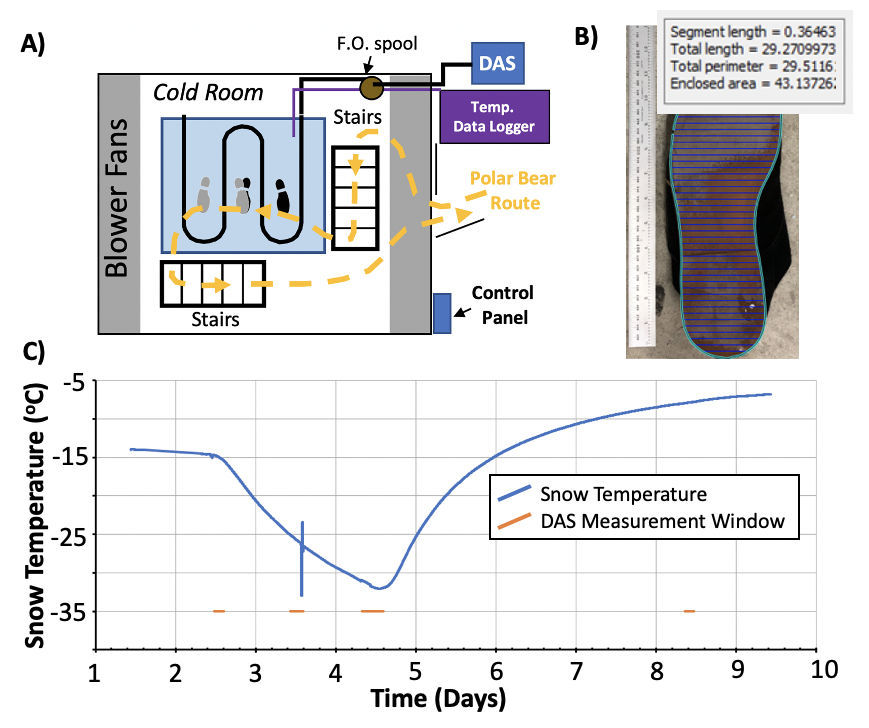
Snow Test Cell Construction: The phase II portion of this experiment was designed to evaluate DAS signatures of polar bear analogs with regard to snow overburden and ambient temperatures down to -40°C. To accomplish this, a snow test cell was constructed and instrumented (Figure 4) with a DAS fiber optic cable that was installed at four levels each 0.25 meters deeper than the next. The walls of the test cell were comprised of plywood and 5 cm thick foam insulation. The cable was snaked through each level to maximize the number of gauge lengths present at each depth. A thermocouple was maintained at a depth of 0.6 meters throughout the test to measure in-situ snow temperature. Natural snow collected near the facility in early spring and stored in cold rooms was placed within the test cell and compacted at each 0.25 m level using a 4.5-kilogram tamper, in an attempt to simulate compacted snow. Finally, a microphone was placed near the surface in order to assess acoustic vs. seismic energy as the DAS system cannot distinguish the two (Figure 5A). For instance, would the audible crunching of the snow crust or the simple foot pressure be the primary signal source?
Humans as Polar Bear Source Analogs: For this study we employ polar bear analogs (e.g., humans) of varying shapes and sizes as our energy source. Since the DAS system measures strain rate, we consider foot pressure as the distinguishing characteristic, assuming the two are related through Young’s Modulus. By introducing analogs of varying foot surface area and mass we attempt to cover a range of anticipated polar bear foot pressures. Both polar bears and humans walk using plantigrade locomotion, meaning they walk with the entire sole of the foot in contact with the ground (Pagano and others, 2018). While polar bears are considerably larger than humans, their large foot diameter in conjunction with number of points of contact when walking results in a comparable foot pressure to that of a human. To illustrate this, we calculated the average polar bear foot pressure using published weights and paw dimensions. Pressure is defined as force divided by surface area, where force is equal to mass multiplied by acceleration. In this case we assume an acceleration of 1, making force equal to mass.
For our tests the foot pressure for humans ranged from 1,663 kg/m2 to 3,669 kg/m2 (assuming 1 point of contact while walking). The surface area of a polar bear paw is nominally reported as 0.3 m in diameter (Stirling, 2009); however, one reference went so far as to state the forepaws are approximately 0.14 m long and 0.23 m wide, while the hind paws are 0.33 m long by 0.23 m wide (Brown, 1993). ). The large surface area of polar bear paws serves to facilitate swimming, weight distribution, and traction on otherwise precarious snow and ice surfaces (Stirling, 2009). Whether using the nominal estimate or the slightly more detailed estimate of paw surface area, the expected foot pressure of an average male polar bear weighing 450 kg is between 2,067 kg/m2 and 2,122 kg/m2, which is centered within our test range (assuming 3 points of contact while walking). While we do not expect the individual foot falls to result in a unique signature when acquired in a field setting, the ambulatory signature of the successive foot falls is likely to be unique to polar bears.
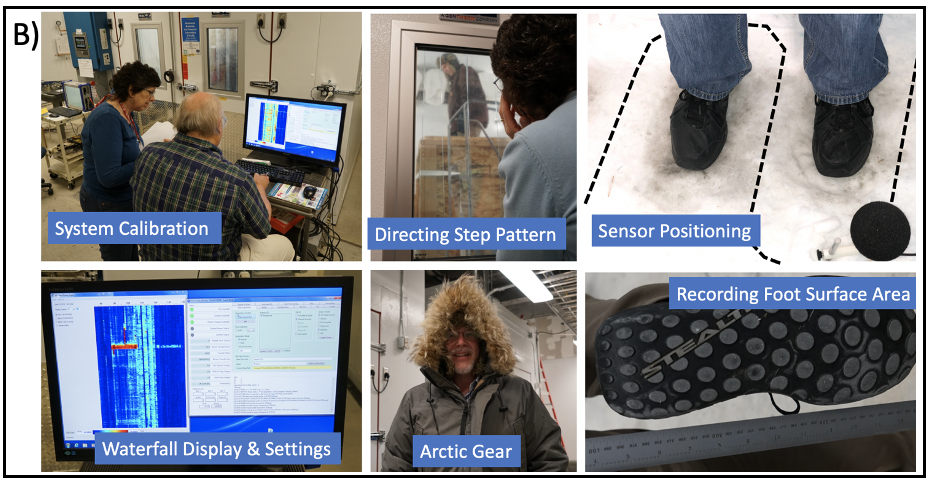
Snow Test Cell Experiments: As many as 15 individual polar bear analogs were used for this test. Figure 6A demonstrates the path of each analog polar bear. The analog polar bear was to enter the cold room, ascend the stairs and position their feet at source position 1 (Figure 4). They would then carefully shift their weight from foot to foot four times. Next, the analog polar bear would move to position 2, repeat the weight shifting and then descend the stairs and exit the room. In order to calculate foot-pressure each subject’s weight was recorded as was a scaled photograph of their shoe. The shoe image was orthorectified using the imbedded scale and surface area was calculated using a digitization tool (Figure 6B). A range of human foot pressures were used to relate to the foot pressure of polar bears in this study. In all, 16 different polar bear analogs completed testing with a diverse range of mass and shoe sizes, resulting in a wide range of foot-pressures. Figure 5C shows the full temperature range of the snow cell during the test. The cold room achieved ambient temperatures of -40oC while the effective snow temperature measured via the thermocouple at a depth of 0.6m and near the test side wall did not drop below -33oC
RESULTS
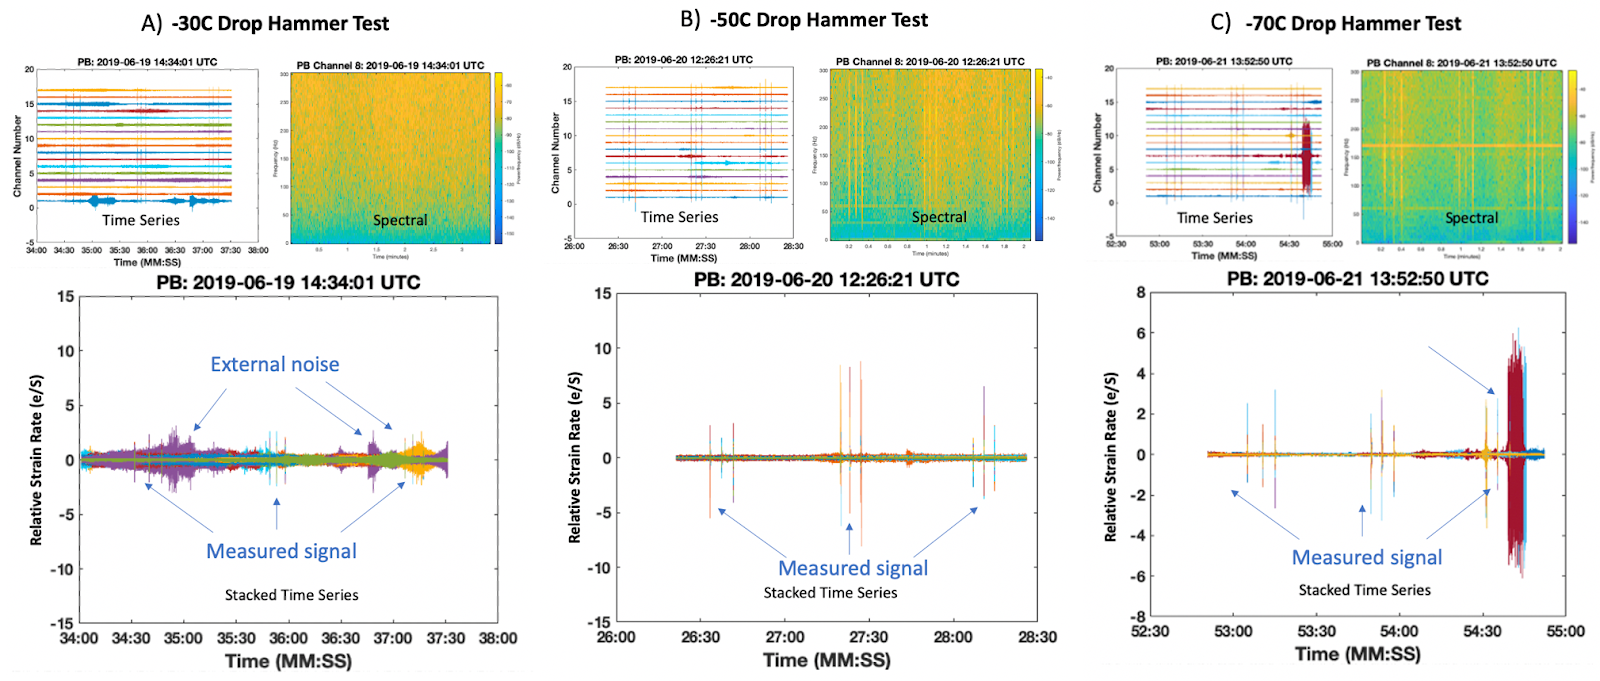
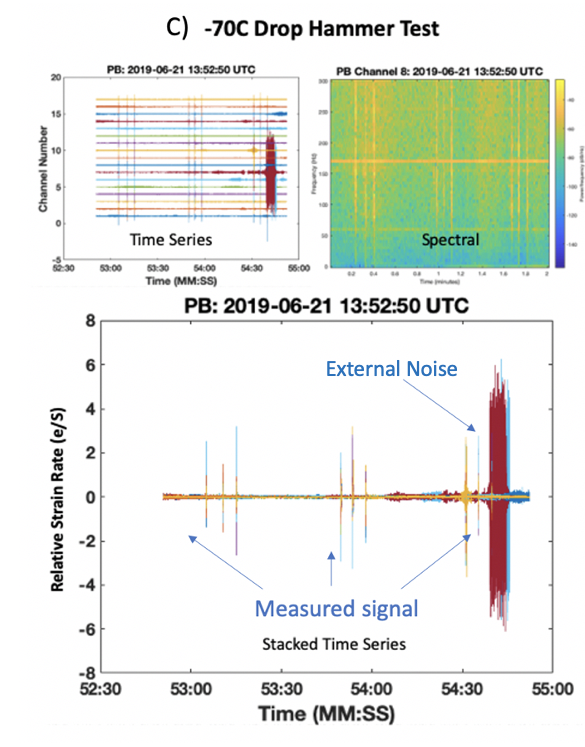
Phase I Results: Phase 1 example results obtained at -30oC (Figure 7A), -50oC (Figure 7B) and -70oC, are presented (Figure 7C). Each of the subset figures includes three plots: 1)signal amplitude by channel vs. elapsed time; 2) frequency domain spectral data with frequency on the y-axis, elapsed time on the x-axis, and power in dB/Hz on the z-axis; and 3) a stacked view of all the channels with relative strain rate on the y-axis and time on the x-axis. In each example we can see the three sets of three weight drops at each of the displayed temperatures.
At -30oC, significant external noise, likely originating from the MTS compressor was observed on some channels. This noise was likely related to the spooling of the sensor relative to the enclosure; however, where the compressor noise was not present, a clear response could be observed in the channel-sorted timeseries and the stacked time series. No clear spectral response was observed. The maximum strain rate observed was around 3 e/S. When the temperature was lowered to -50oC the response could be seen on all gauge lengths, including the spectral image. The maximum strain rate at -50oC was 9 e/S, while the maximum strain rate observed at -70oC was also about 3 e/S. Overall, the noise floor seemed to decrease with decreasing temperature, although the -50oC data set did display the best overall SNR.
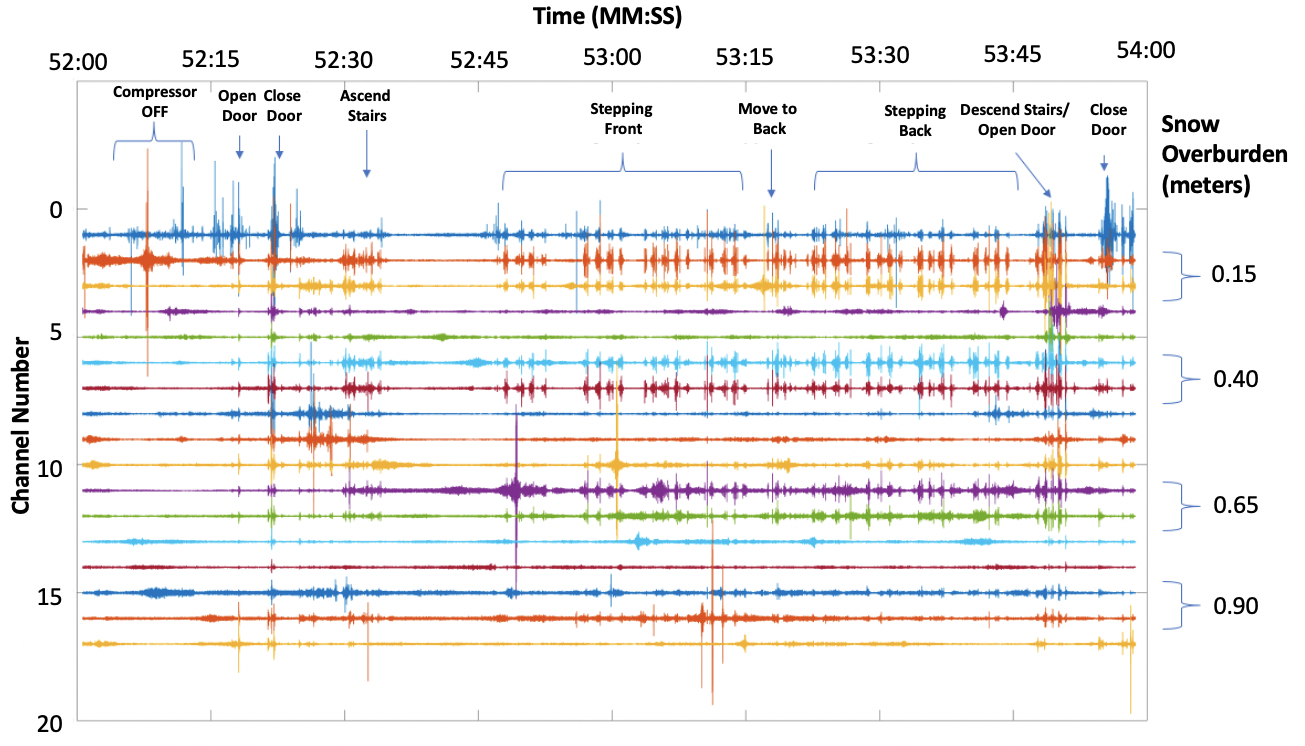
Phase II Results: Select Phase II results can be seen in Figure 8, where an example of large polar bear analog DAS signatures are mapped to an event log at -31oC with regard to depth of snow overburden. As one might expect, with increasing distance from the source, the overall signal amplitude and resulting SNR decreased; however, the rate of signal attenuation is specific to the material, in this case the snow (Telford and others, 1990). A less porous snow pack or even ice should result in better conveyance of signal or a lesser attenuation rate (Telford and others, 1990). Even external noise sources, located adjacent to the test cell such as closing the cold room door and ascending/descending the access stairs showed the general reduction in amplitude with depth, suggesting the insulation within the test cell effectively focused wave propagation primarily through the top of the open test cell, rather than through the walls and floor of the test cell.
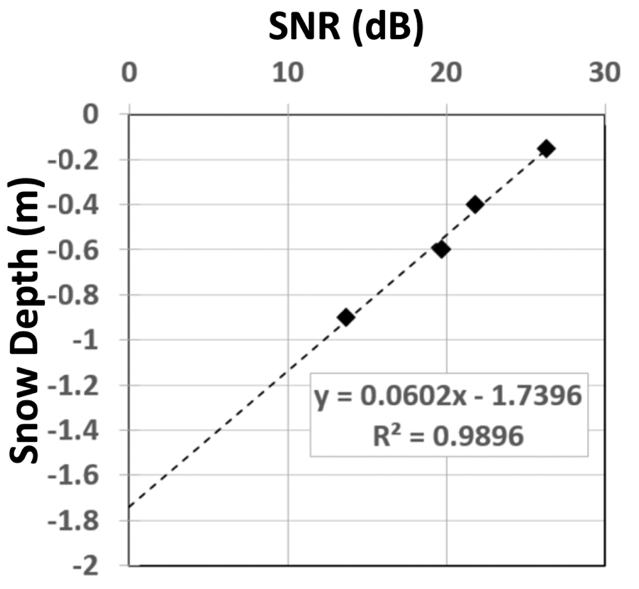
Finally, average SNR was calculated for the depth-dependent responses (Figure 9). The measurement depth was plotted versus SNR to estimate maximum overburden and efficacy for these conditions. Specifically, in this case, the maximum overburden represents a large analog polar bear, shifting weight in the direct vicinity of the sensor at -31oC. Maximum overburden will vary for polar bears of varying sizes, walking at varying speeds and effective foot pressure.
DISCUSSION
While limitations of the tests are clear throughout (e.g. no actual polar bears were used in testing, does not account for the step pattern of polar bears of varying sizes and whether they are running or walking, etc.), we believe there are sufficient data to warrant further investigation through a small-scale installation. In phase II, the configuration of the fiber at each depth within the test cell likely enhanced the signal by spatially constraining the 2 m gauge lengths to the dimensions of the test cell. By routing the fiber from side to side, rather than extending linearly, the gauges were collocated within a much smaller spatial extent, which has been demonstrated to increase SNR (Peterson and others, 2020). The proximity of the cable relative to the source locations also likely resulted in a greater signal then might be observed in an actual field deployment.
Relating the foot pressure of humans to that of polar bears, at first consideration seems counter intuitive, where a polar bear’s mass is so much greater than that of a human. But, considering they have very large paws contributing to greater weight distribution and they walk on four paws, with three in contact with the ground at all times, it actually gets us much closer to a valid comparison. Specifically, when compared to the relatively small foot pressures and bipedal weight distribution, a human can exceed the foot pressure of a large polar bear. Similarly, we might expect a larger human to have a greater foot pressure than that of a smaller human; however, surface area of the foot once again comes into play, a small human with very small feet could have a much greater foot pressure than a large human with average feet.
The Phase I results, demonstrate a relatively consistent functionality of the fiber optic cable down to temperatures as low as -70oC, exceeding the maximum recorded temperature at Summit Station. Further, Phase II demonstrated first-of-their-kind results that DAS systems coupled in snow rather than typical earth materials can result in clear signal detection with SNR as high as 27 dB near the surface, at -31oC, and without any additional SNR enhanced coiling techniques. Finally, we demonstrated relative effects of increasing overburden on measured SNR. It is important to note the testing was done with extremely light step patterns equivalent to almost a shifting of weight rather than actual steps in order to evaluate the extreme condition, indicating that a much greater SNR will be observed for a true ambulatory condition. Yet, the snaked cable layout pattern used to ensure sufficient sampling within a single snow and ice horizon may also have resulted in an increased SNR when compared to a linear deployment. With regard to overburden sensing, an SNR of 13 dB was achieved at an overburden of 0.91 m for a large-sized polar bear analog, with a projected maximum overburden of 1.74 m. Again, it is likely that this maximum overburden estimate is a worst-case scenario considering the light step pattern. Further, the density of the snow pack will affect signal transmission (Kohnen, 1974; Telford and others, 1990; Albert, 1993). All-in-all the results support the necessity of a test phase deployment in the field. We recommend a small-scale test loop of 1 km be deployed to further assess overall functionality under actual conditions. If chosen for use at Summit Station the DAS fiber sensor will be laid out in a 20 km perimeter surrounding the entirety of the research camp and a custom alert system will be developed and monitored throughout the research season.
CONCLUSION
This preliminary testing was intended to evaluate the DAS technology for deployment as an early warning perimeter detection sensor in arctic research camps, specifically for the detection of polar bears displaced by diminishing sea ice extent. Further, this testing was completed within temperature ranges indicative of the NSF Summit Station research camp. Polar bears, while endangered themselves, present an existential threat to remotely located researchers and local communities. In this study we demonstrate DAS functionality in laboratory conditions representative of extreme cold environments and with increasing snow pack relative to analog polar bear source signatures. Results indicate sufficient signal for advancing to the next stage of research to include a small-scale field deployment at NSF Summit station.
ACKNOWLEDGEMENTS
Funding for this research was provided under the U. S. National Science Foundation-Office of Polar Programs-Arctic Sciences-Research Support and Logistics Program (NSF-OPP-ARC-RSL) for the opportunity to perform this exciting research. The authors thank Mrs. Ginger Boitnott, Mrs. Bonnie Jones, and Mr. Kent Hathaway for their assistance in the laboratory. Special thanks to Dr. Emily Asenath-Smith who provided access to the cold box testing facility and to Mr. Andrew Bernier for his assistance with operation of the MTS environmental chamber. The authors are grateful to Mr. Clay Kirkendall of the Naval Research Laboratory for his assistance with the DAS system. Finally, the authors heartily thank each of the 15 analog polar bears for their eager willingness to participate in this study and most excellent performances as polar bears.
REFERENCES
Albert, D., 1993. Attenuation of outdoor sound propagation levels by a snow cover. US Army Corps of Engineers, Cold Regions Research & Engineering Laboratory Technical Report, 93-20, AD-A275 387.
Ajo-Franklin, J., Dou, S., Lindsey, N.J., Monga, I., Tracy, C., Robertson, M., Rodrigues Tribaldos, V., Ulrich, C., Freifeld, B., Daley, T.M., and X. Li, 2019. Distributed Acoustic Sensing Using Dark Fiber for Near-Surface Characterization and Broadband Seismic Event Detection. Scientific Reports 9, 1328.
Castongia, E., Wang, H.F., Lord, N., Fratta, D., Mondanos, M., and A. Chalari, 2017. An Experimental Investigation of Distributed Acoustic Sensing (DAS) on Lake Ice. Journal of Environmental and Engineering Geophysics, 22(2):167-176.
Brown, G., 1993. The Great Bear Almanac. Lyons, Press, p.76.
Costley, R.D., Galan-Comas, G., Kirkendall, C.K., Simms, J.E., Hathaway, K.K., Parker, M.W., Ketcham, Smith, E.W., Folks, W.R., Milburn, T.W., and H.M. Wadman, 2018. Distributed Acoustic Sensing for Near-Surface Seismic Applications. Journal of the Acoustical Society of America, 144(3):1702-1703.
Costley, R.D., Galan-Comas, G., Kirkendall, C.K., Simms, J.E., Hathaway, K.K., Parker, M.W., Ketcham, Smith, E.W., Folks, W.R., Milburn, T.W., and H.M. Wadman, 2017. Spectral Analysis of Surface Waves with Simultaneous Fiber Optic Distribution Acoustic Sensing and Vertical Geophones. Journal of Environmental and Engineering Geophysics 23(2):183-195.
Glaser, D.R., Costley, R.D., Hathaway, K.K., Boitnott, G.L., and Weale, J., 2021. Snow Coupled Distributed Acoustic Sensing for Intrusion Detection of Polar Bears in Arctic Camps. Symposium on the Application of Geophysics to Environmental and Engineering Problems Proceedings: 262-262.
Glaser, D.R., Costley, R.D., Hathaway, K.K., Boitnott, G.L., Weale, J., 2019, Snow Coupled Distributed Acoustic Sensing for Intrusion Detection of Polar Bears in Arctic Camps, NS11B-0634, Poster. American Geophysical Union Fall Meeting 2019, Dec. 9-13, Washington, D.C.
Greene, H., Glaser, D.R., Costley, R.D., Boitnott, G.E., Hathaway, K., and Weale, J., 2019, Detecting polar bears with buried fiber optic sensors. 2019 Science and Technology Symposium – US Army ERDC Cold Regions Research & Engineering Laboratory.
Hathaway, K.K., Costley, R.D., Smith, E.W., Milburn, T.W., and J. Piccuci, 2013. Ocean wave seismic and acoustic noise detected with distributed fiber optic sensor array. Journal of the Acoustical Society of America, 134(5):4180.
Hudson, T.S., Baird, A.F., Kendall, J.M., Kufner, S.K., Brisbourne, A.M., Smith, A.M., Butcher, A., Charlari, A., and A. Clarke, 2021. Distributed Acoustic Sensing (DAS) for Natural Microseismicity Studies: A Case Study from Antarctica. Journal of Geophysical Research: Solid Earth, 126, e2020JB021493.
Jousset, P. Reinsch, T., Rydberg, T., Blanck, H., Clarke, A., Aghayev, R., Hersir, G.P., Henninges, J., Weber, M., and C.M. Krawczyk , 2018. Dynamic strain determination using fibre-optic cables allows imaging of seismological and structural features. Nature communications 9:2509.
Katz, C., 2018, Polar bears appear where they never were before. National Geographic, https://www.nationalgeographic.com/environment/2018/07/polar-bears-summit-station-greenland-ice-sheet-news/
Kohnen, H., 1974. The temperature dependence of seismic waves in ice. Journal of Glaciology, 13(67):144-147.
Laidre, K.L., Born, E.W., Gurarie, E., Wiig, O., Dietz, R. and Stern, H. 2012, Females roam while males patrol: divergence in breeding season movements of pack ice polar bears (Ursus maritimus). Proceedings of the Royal Society B 280: 1-10. DOI: 10.1098/rspb.2012.2371 Open access http://rspb.royalsocietypublishing.org/content/280/1752/20122371
Miah, K. and D.K. Potter, 2017. A Review of Hybrid Fiber-Optic Distributed Simultaneous Vibration and Temperature Sensing Technology and Its Geophysical Applications. Sensors 17(11):2511.
Pagano, A. M., Carnahan, A. M., Robbins, C. T., Owen, M. A., Batson, T., Wagner, N., Cutting, A., Nicassio-Hiskey, N., Hash, A. and Williams, T. M., 2018. Energetic costs of locomotion in bears: is plantigrade locomotion energetically economical? Journal of Experimental Biology, 221(12).
Peterson, D., Meyer, A.C., Dunn, K.G., Vecherin, S.N., Glaser, D.R., Costley, R.D., Wheeler, A., Jones, B.J., Dunn, E.B., and M. Moran, 2020. Improving Detection of Acoustic Sources by Coiling Fiber Optic Cable, Proc. SPIE 11418, Detection and Sensing of Mines, Explosive Objects, and Obscured Targets XXV, 114180B, 24 April 2020
Pope, K., 2019, Dwindling sea ice brings polar bears in conflict with humans. Discover, August 3, 2019. https://www.discovermagazine.com/planet-earth/dwindling-sea-ice-brings-polar-bears-in-conflict-with-humans#.XT-Njy2ZN24
Scambos, T., Stroeve, J., Koenig, L., 2021. Rain at the Summit of Greenland. Published in Greenland Ice Sheet Today on August 18, 2021, by National Snow and Ice Data Center, http://nsidc.org/greenland-today/2021/08/rain-at-the-summit-of-greenland/
Stirling, I., 2009. Polar Bear: Ursus maritimus. Encyclopedia of Marine Mammals, Second Edition, p.888-890.
Sterling, I., and Derocher, A.E., 2012. Effects of climate warming on polar bears: a review of the evidence. Global Change Biology, 18:2694-2706.
Telford, W.M., Geldart, L.P., Sheriff, R.E., and D.A. Keys, 1990. Applied Geophysics, Second Edition. Cambridge University Press, New York.
Walter, F., Gräff, D., Lindner, F., Paitz, P., Köpfli, M., and A. Fichtner, 2020. Distributed acoustic sensing of microseismic sources and wave propagation in glaciated terrain. Nature Communications, 11, 2436.
BIOS

Dan is a Research Geophysicist for the US Army ERDC Cold Regions Research & Engineering Laboratory. His research interests are centered around electrical and electromagnetic sensing with a growing interest cryogeophysics. He is also a PhD candidate in the Earth & Environmental Science Department at Rutgers University Newark with a focus in Near-Surface Geophysics. He holds a Master’s of Science degree from the University of Missouri with a focus in hydrogeophysics and an undergraduate degree from the University of Southern Maine with a focus in Environmental Geophysics.
He is a licensed professional geologist and project management professional. Mr. Glaser has been an Associate Editor for the Journal of Environmental and Engineering Geophysics since 2010 and is a member of the EEGS Board of Directors since 2020. Mr. Glaser has over 20 years of experience in applying novel imaging methods to environmental and engineering problems.
