
By Justin Anning1
1Surrich Hydrographics, Western Australia.
Abstract
Seismic reflection and refraction surveys provide valuable sub-surface information with respect to coastal geotechnical projects. The seismic reflection method maps layers and interfaces, while the refraction method maps compressional rock velocities.
Single channel seismic reflection is referred to as Sub Bottom Profiling (SBP) and the examples shown herein were performed using a boomer seismic source. Utilizing the same survey vessel and positioning system used for the SBP survey, seismic refraction surveys can be performed in a mobile towed configuration, using a small volume airgun and multichannel streamer. We refer to this methodology as Continuous Marine Seismic Refraction (CMSR).
Two examples are presented which demonstrate the advantages of acquiring both SBP and CMSR. In both cases the geophysical surveys precede the drilling investigation. The first example demonstrates where CMSR is assessed as providing more reliable geotechnical information than SBP amongst complex coastal sedimentary and metamorphic geology. The second example in a soft rock sedimentary environment demonstrates excellent SBP penetration, with correspondingly poor CMSR information due to the low compressional rock velocities. However, it also demonstrates where the CMSR data provides useful data immediately adjacent to the shoreline where the SBP profile is affected by coarse sediments and the CMSR continues to supply information. The discussion also touches on the benefits of applying advanced processing methodologies to SBP data.
Introduction
Hydrographic and geophysical surveys are routinely conducted as a component of a geotechnical site assessments for coastal infrastructure projects where dredging or marine construction activities are planned.
The following techniques are commonly requested where seafloor topography and sub-seafloor characteristics are required:
- Multibeam Bathymetry
- Side Scan Sonar
- Marine Magnetics
- Single Channel Seismic Reflection, by Sub Bottom Profiling
- Seismic Refraction
Multibeam Bathymetry surveys provide detailed measurements of seafloor topographies. As such, they are commonly governed by surveying specifications and standards to provide assurances with regards to accuracies and reliability.
Where coastal developments are concerned, elevations provide insight into the broader context of the development and routinely influence their economic viability. The two most common influencing factors include the measure of seafloor topography to calculate dredged quantities and the determination of water depths for coastal design purposes. As such, coastal bathymetric surveys are supervised by a qualified hydrographic surveyor to control the reliable delivery of information to the correct horizontal and vertical datums. Acquisition of geophysical information is less dependent on positional accuracies; however, their resulting interpretations benefit from being accurately aligned with the bathymetry and thus the project datum. We note that the seabed is a dynamic environment therefore consideration must be made to acquisition time frames if the bathymetric survey is being utilized as the datum control for the geophysical interpretations.
Side Scan Sonar (SSS) and Marine Magnetics (Mag) sensors typically provide the minimum specification of a site clearance survey, where information is required on obstructions to placement of structure at the seafloor, or where seafloor hazards are concerned. SSS provides high resolution images of the seafloor reflectivity and is ideally acquired from a tow-fish operating close to the seabed. The resulting images are interpreted by the geophysicist or marine scientist to identify seafloor structures and objects at the seafloor level. A marine magnetic sensor may be towed immediately behind the SSS to identify ferrous objects on or beneath the seabed and may also assist with mapping the geology. Specifications for SSS and Mag surveys vary depending on the intended targets, for instance, a search for a wreck or debris will vary from a detailed survey for unexploded ordnance (UXO).
Single Channel Seismic Reflection and Multi-Channel Seismic Refraction methods provide information on subsurface conditions where detailed geo-stratigraphic information is required. Single Channel Seismic Reflection is commonly undertaken under the pseudonym ‘Sub Bottom Profiling’ (SBP), encapsulating the acquisition of seismic reflection events from a seismic source and single receiver channel. Common SBP systems include Boomer, Sparker and Parametric systems. With the increased access to simplified SBP systems, combined with the generalized or basic processing routines applied to the acquired seismic data by smaller geophysical practitioners, the resulting investigation methods have become more routine and cost effective. However, we show that the SBP results can vary with respect to the processing methods and that their interpretation is increasingly aided when assessed in conjunction with other geophysical datasets.
The marine Seismic Refraction method measures in-situ compressional P-wave velocity, or Vp, from a linear array of receivers positioned at the seafloor or in the water column. With the increased complexity of acquisition, Seismic Refraction is less common acquisition method in other international settings. However, Australia’s nearshore geological and geotechnical conditions have inspired some of the highest rates of application of Seismic Refraction surveys, fostering roughly nine contractors and consultants to develop ‘in-house’ or bespoke seismic refraction systems. Furthermore, a standard methodology has not evolved, and different operators adopt varying preferences for acquisition methods, processing, presentation and interpretation. Therefore, a request for seismic refraction is commonly answered with varying acronyms, methodologies and claims of relative success in achieving (or over-achieving) the required specification, more commonly defined by depth of investigation.
Marine Seismic Refraction for geotechnical applications evolved from onshore static surveying methods, where the receiver channels are positioned on the seabed surface in a similar method to land surveys. This came at the need for information across shorelines, required by nearshore dredging, horizontal directional drilling or shoreline infrastructure, such as Wharves. Marine channels (hydrophones) and land channels (geophones) were combined to obtain continuous Vp profiles along transition zone alignments, ultimately precluding or fine tuning the requirements for expensive offshore drilling at early project stages. More modern Marine Seismic Refraction systems were developed to acquire data in a mobile towed configuration which allows for more efficient acquisition and can be programmed in with other geophysical or environmental investigation methods. We refer to this towed method as Continuous Marine Seismic Refraction (CMSR).
The aim of this paper is to share some industry experiences of the benefits to coastal geotechnical projects where both SBP Boomer and CMSR have been performed. We provide examples from 2 contrasting geological scenarios. Although it is not the main purpose of this paper, we also touch on advanced processing steps available to enhance SBP boomer data.
SBP Boomer Methodology
The SBP technique relies on the ability of a subsurface object or layer to reflect a coherent soundwave back towards the receiver at a measurable strength. There is a great diversity in SBP systems with associated trade-offs between abilities and limitations. Users may find manufacturer’s specifications for resolution and depth of penetration are rarely achieved in the geologies they are trying to operate in, and results can range from ‘blindingly good’, to ‘blisteringly frustrating’.
The examples presented here were acquired using a 150 Joule boomer source mounted on a floating frame and towed behind a vessel at less than 3 knots. The pulse rate is 3 Hz and station spacings range from 30-50 cm. Figure 1 shows SBP boomer acquisition from a small vessel. The signal is received through a 12-element, single channel streamer which is towed on an outrigger close to the surface, offset roughly 4m to one side of the source. The source and receivers are located either side of the propeller wash, acquired at low speed in calm waters to obtain a clean repeatable pulse while minimizing noise, and maintaining good source-receiver geometry. The distance the source/receiver is towed behind the vessel may vary from 8 to 15 m (or greater on larger vessels) and depends on various factors. A close tow (e.g. 8 m) can maintain improved source-receiver geometries and be efficient when surveying small coastal sites requiring many turns, however, may be subjected to noise from the vessel engines. A longer tow may reduce vessel noise; however, the source/receiver geometries take longer to stabilize after a turn, with corresponding missing data on lines requiring turns to avoid collision with shore or structures.
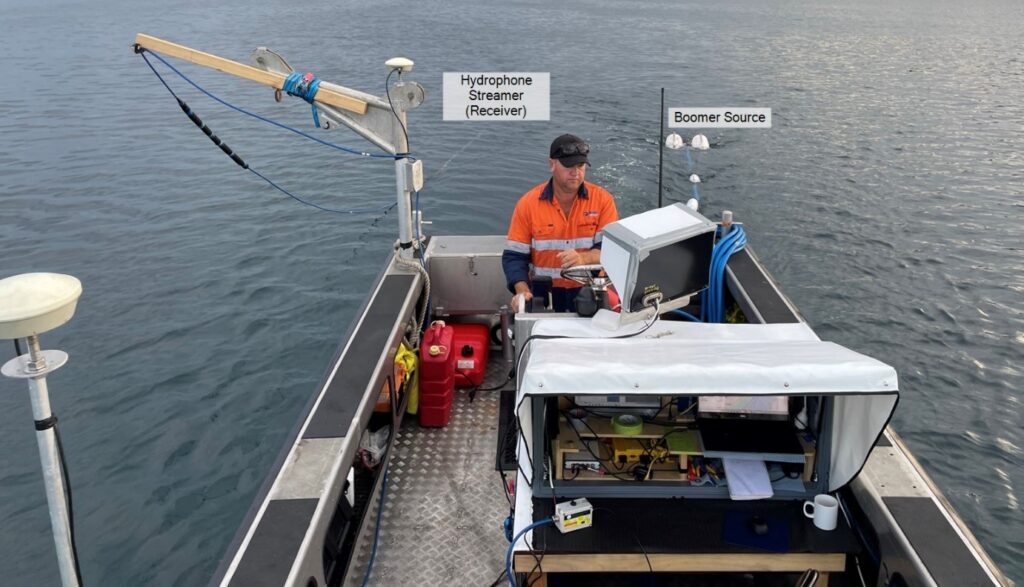
Figure 1. SBP Boomer system during data acquisition.
CMSR Methodology
The CMSR methodology performed by Surrich Hydrographics consists of towing a seismic source and array of receivers in an in-line configuration behind a moving vessel, less than 3 knots. The seismic source is a 10 or 20 cu.in airgun, towed near the seabed with the assistance of a deck winch. Attached immediately behind the airgun is multichannel seismic streamer established to be neutrally buoyant in the water column, monitored by a sensor mounted behind the airgun for depth and altitude above the seabed. The system can then be operated with either constant altitude (above seabed) or depth, or a hybrid of each, depending on the seabed topography.
The receiving array typically includes 32 channels with variable spacings along a 100 m-long streamer, including 1.5625 m, 3.125 m and 6.25 m. There is one hydrophone per channel. While acquisition specifications are strongly controlled by site conditions and the survey vessel, the system is normally able to acquire a record every 5 – 7 m along the investigation alignment. The airgun uses compressed air, supplied by a portable air compressor, allowing for the operation from a small vessel. Figure 2 shows a typical seismic record picked for the primary arrival times, as required by Vp processing.
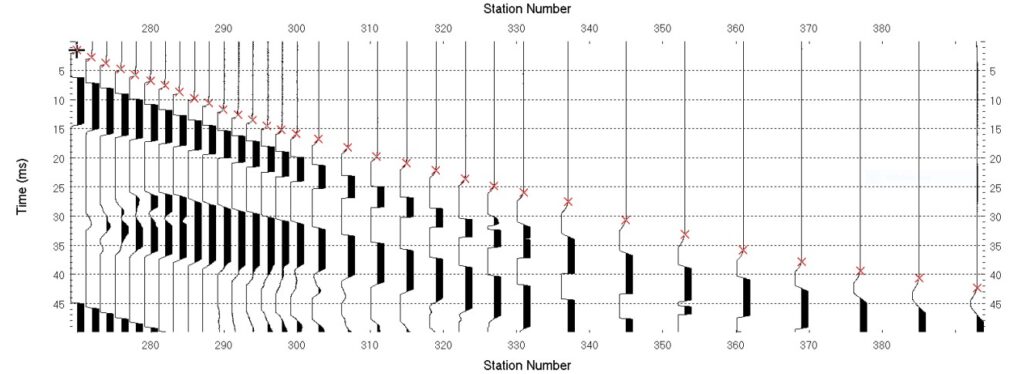
Figure 2. CMSR Shot record example.
Each vertical trace in figure 2 represents the recorded signal from a hydrophone, timed from the moment the airgun is fired. The red crosses represent the moment the seismic wavefront travelling away from the airgun, reaches each hydrophone. Higher velocities in the ground bend, through the process of refraction, the seismic wavefront, sending the refracted energy back up to the receiving array. The refracted wavefront reaching the surface travels at a greater speed than the direct wave through the water column. If this faster refracted wavefront overtakes the direct wave AND is detected within the length of the streamer, the higher subsurface velocities are represented in the resulting Vp interpretation.
The recorded times from each individual shot record are compiled along a travel-time plot, demonstrative of the recorded times along the surveyed alignment (figure 3). This information is used to model the Vp profile using tomographic inversion software.
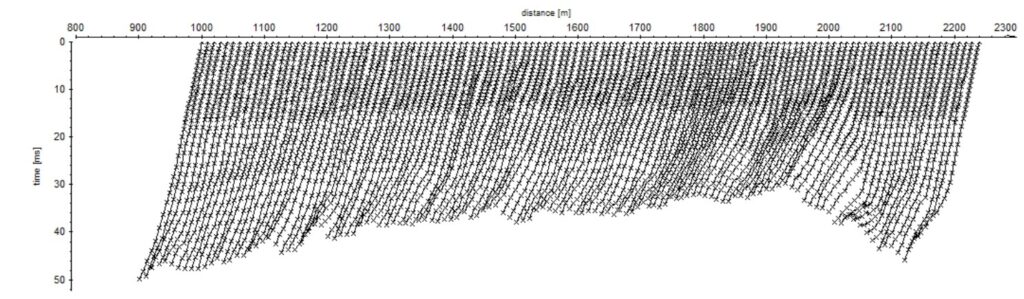
Figure 3. CMSR travel time plot
Example 1 – Marine sediments overlying basement rocks with highly variable hardness and weathering
This example demonstrates a scenario where there is knowledge of the regional geology, however no drilling in the immediate survey area exists and we are required to assess the subsurface based on SBP and CMSR datasets. The site consists of variable intertidal, upstream marine sediments, over a highly steeply dipping metamorphic bedrock. We demonstrate the value of acquiring the CMSR data in addition to the SBP.
The marine sediments at the site consist of Quaternary deposits typical of mangrove intertidal systems, including clay, silt, sands, gravels, shelly sand and coralline sands. These sediments are underlaid by shallow rock, mapped regionally as a heavily folded metamorphic formation with variable weathering patterns and mineralisation, including intact quartz veins.
Geotechnical aims for both dredging and construction activities include mapping the subsurface bedrock elevations and locating high velocities within the bedrock that may indicate quartz veins – a known obstruction to efficient dredging and a source of latent claims at adjacent sites. No geotechnical drilling results existed at the time of survey in the immediate project area.
Figure 4 shows an example SBP section from the project. “Interface A”, digitized as the red line, is the deepest continuous interface visible in the data. The nature of this interface is expected to vary along the section, and reasonable possibilities include the following:
- Interface between the marine sediments and bedrock.
- Interface between soft weathered bedrock and harder less weathered bedrock.
- Reflections from a coarse basal unit immediately overlying weathered or unweathered bedrock.
- Reflection from a coarse grained or calcrete layer within the marine sediments.
Each of these possibilities may be associated with attenuation of the seismic signal such that that no deeper reflections with a geological source are reliably detectable. Deeper reflectors visible beneath the digitized red line in figure 4 are predominantly interpreted as non-geological artifacts, and have been ignored. Therefore, we can state that Interface-A represents the “minimum depth to hard basement”, and trying to assign a specific geological interpretation to the interface using the SBP data alone will result in gross errors.
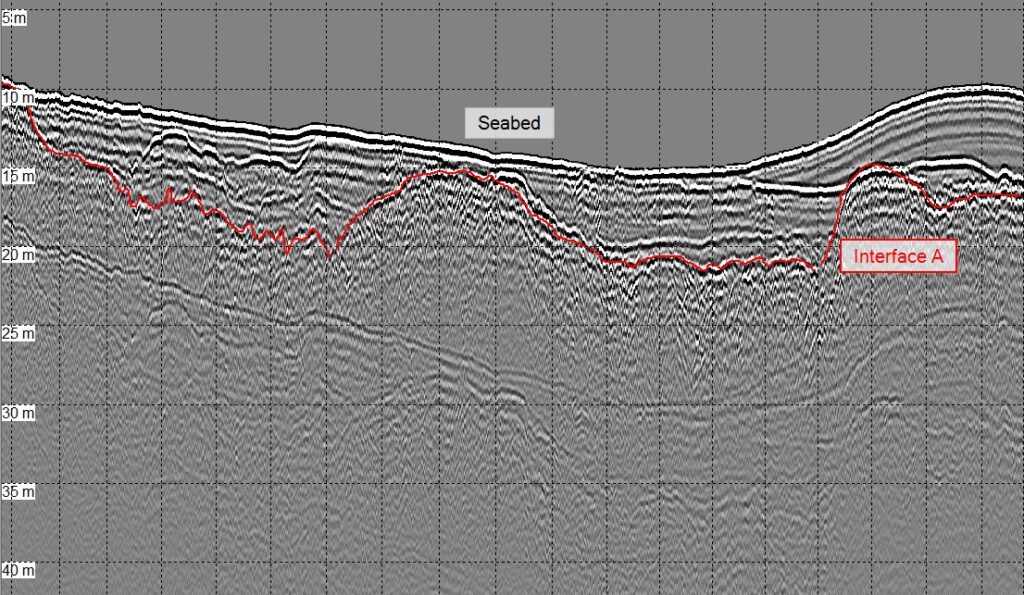
Figure 4. SBP Boomer section. (Vertical lines spaced at 100m intervals)
SBP data was acquired over numerous main lines and tie lines. Interface A, has been converted to elevation and gridded as a surface which is used in the subsequent analysis of the CMSR results.
Figure 5 shows two Vp profiles CMSR-1 and CMSR-2. The upper surface of the Vp sections correspond to the seabed, with the SBP Interface-A also plotted on the sections as the red line.
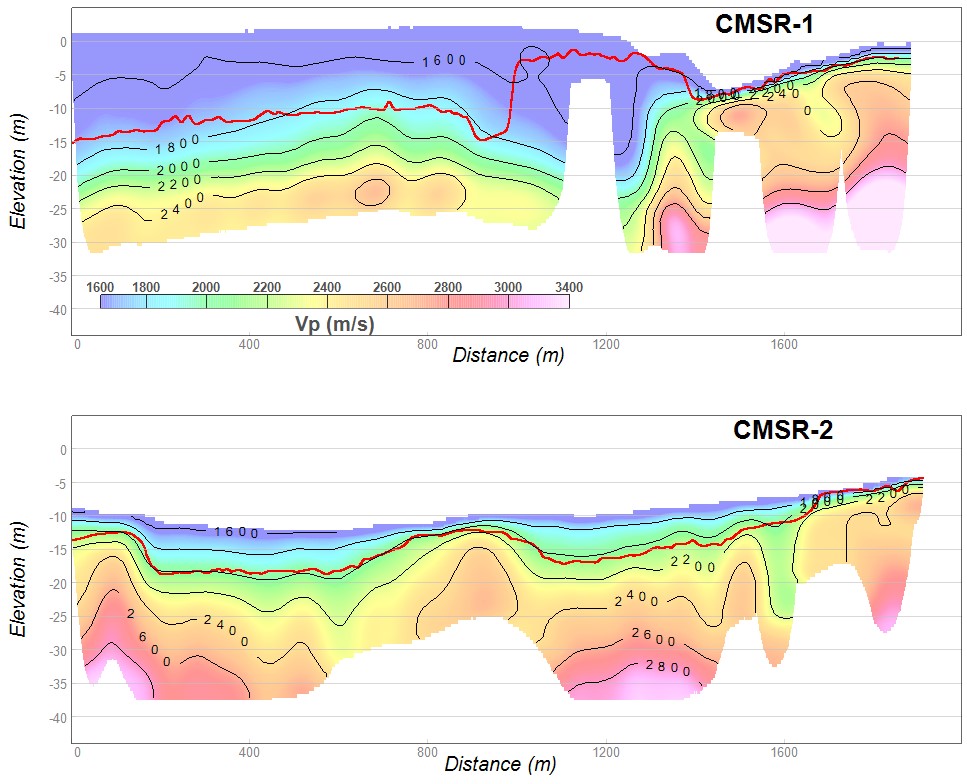
Figure 5. CMSR Vp sections showing Interface-A (from the SBP interpretation).
The Vp sections represents a smoothed model of sub-seafloor Vp structure, whereas in reality the Vp structure is likely to include a combination of varying velocities within the sediments and bedrock. Along CMSR-2, Interface-A surface shows good agreement with the 2000m/s Vp contour, and we can infer Interface-A is probably closely associated with the bedrock interface along this section. Along CMSR-1, Interface-A strongly departs from the Vp section. Where this occurs, we can infer that Interface-A is likely mapping a coarse sedimentary layer.
Until drilling is performed, the CMSR/SBP interpretation is speculative, and trying to define a precise model will lead to errors. However, the key point is that with respect to mapping the interface between the marine sediments and the bedrock, we can appreciate that the CMSR data appears to provide more reliable geotechnically relevant information than the SBP data.
With respect to mapping hard quartz veins, the CMSR is potentially the most useful dataset as it provides information on the bedrock elastic properties, however attempting to perform a simplistic interpretation, for example where ‘high Vp corresponds to higher quartz vein density’, is likely to fail and targeted drilling investigation is required before a specific geological model can be attempted.
Example 2 – Marine sediments overlying low velocity sedimentary rocks
The previous example demonstrated where the CMSR method appears to have more inherent geotechnical value than the SBP. This next example demonstrates an opposite scenario where on first impressions, the soft rocks appear to strongly enhance the SBP results and limit the CMSR results. However, we demonstrate that close to the shoreline the SBP interpretation encounters issues and the CMSR provides additional valuable information.
The data examples presented here are from a geotechnical project at a coastal site containing marine sediments overlying calcareous sedimentary rocks. Geotechnical drilling information was not available for this study. Figure 6, shows a Boomer SBP section acquired adjacent to the coast in 24 m of water with basic processing applied. Figure 7 shows the same section with what might be termed ‘advanced processing’ applied.
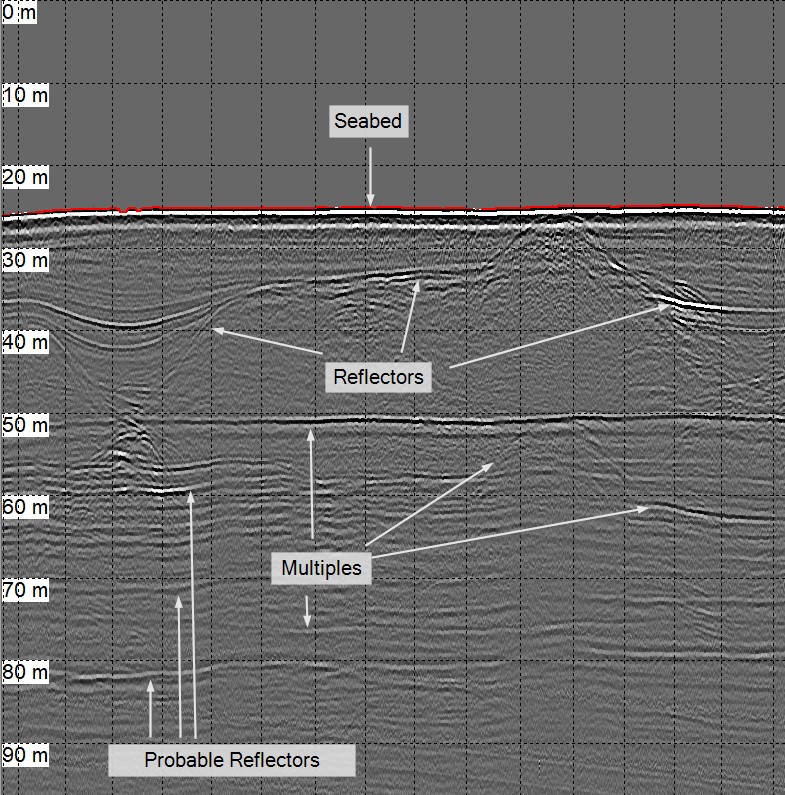
Figure 6. SBP Boomer example – basic processing applied.
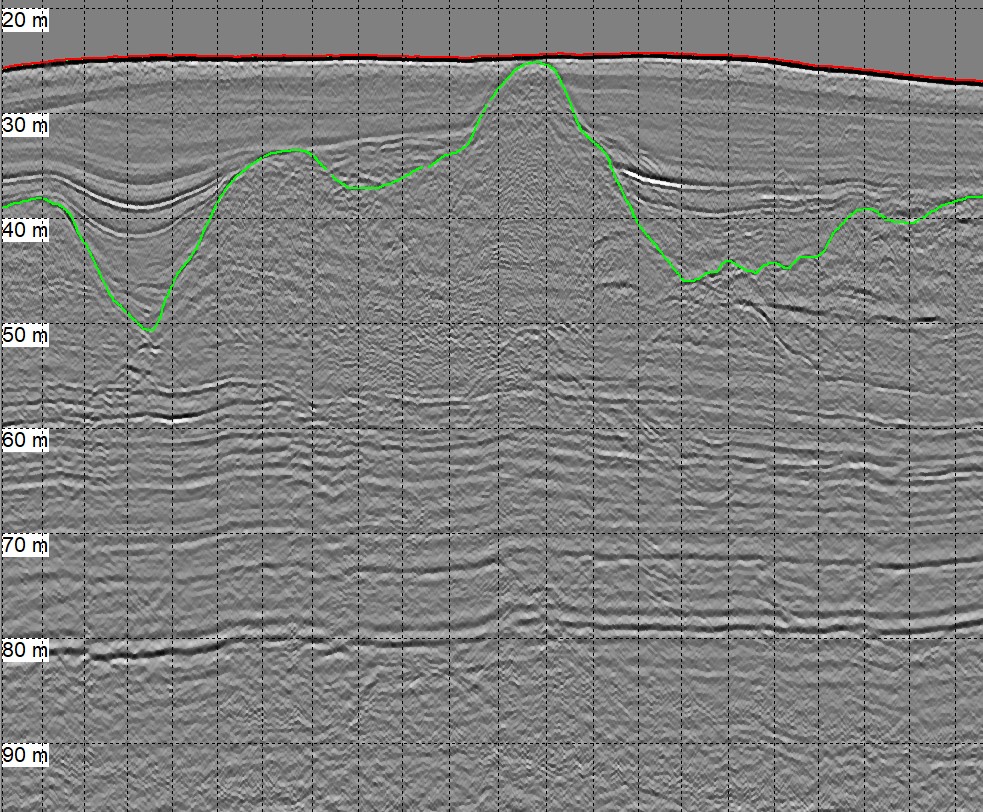
Figure 7. SBP Boomer example – advanced processing applied.
Basic data processing is typically applied to SBP data, including frequency filtering and display amplitude enhancements. This data contains visual complications when interpreting SBP records, such as multiples, ghosts and a broad strong signal from the seabed, as shown in Figure 6. Where deemed advantageous, additional processing steps may be applied to suppress multiples, improve the pulse resolution, and remove diffractions from point and corner reflective features. The following processing steps were applied to the SBP data on this project:
- Amplitude correction.
- Bandpass filtering.
- First breaks picking.
- Time-frequency domain noise attenuation.
- Low frequency wavelet extraction + deconvolution.
- Multiples modelling + adaptive model subtraction.
- De-ghosting with predictive deconvolution.
- Bottom signal extraction + deconvolution (bringing signal to zero phase).
- Stolt 2d migration with water velocity.
- Time variant bandpass filtering.
The marine geophysics industry may not typically perform all of these processing steps as they are time consuming, intensive and require specialized software and seismic data processing experience. However, contractors with the ability to perform advanced processing recognize that near-surface, coastal SBP data may be challenging to interpret, with shallow target reflectors overwritten by non-geological artifacts and reverberating source pulses. Therefore, by performing advanced processing steps, the value of the data is enhanced by uncovering hidden information and improving the accuracy and confidence of the interpretation. Figure 8 shows two of the more interesting CMSR Vp sections from the project area.
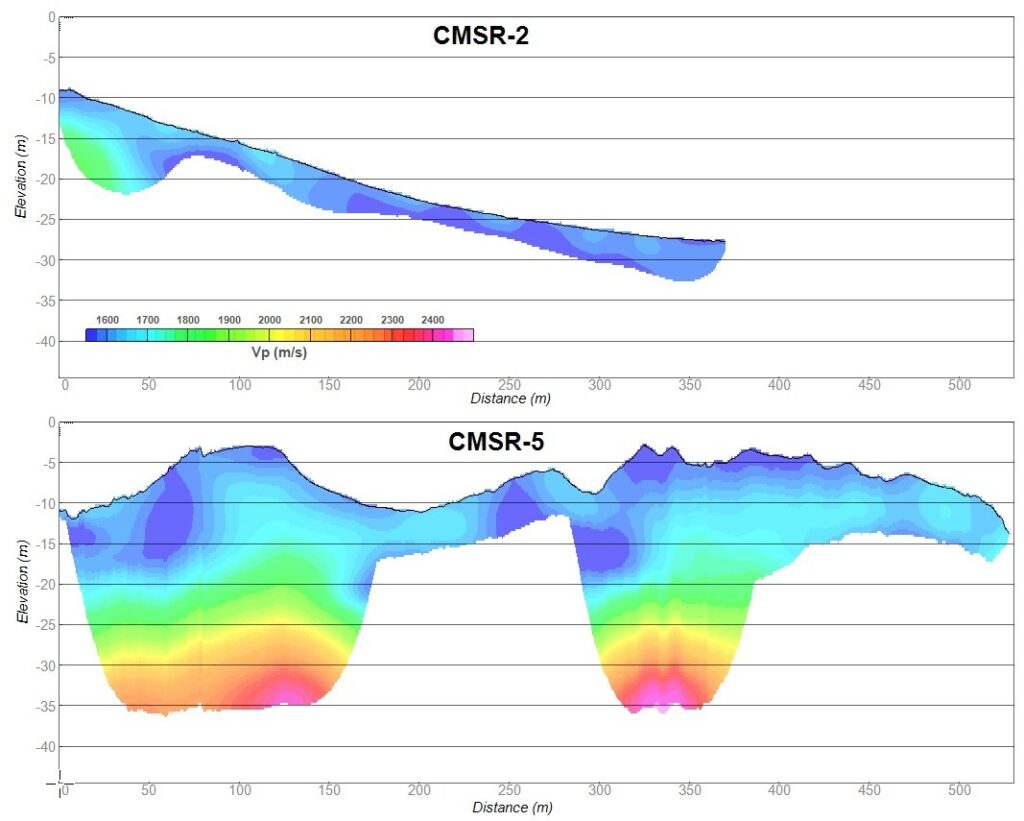
Figure 8. CMSR example sections in low velocity environment.
The first observation is the apparent poor performance of the CMSR method in low Vp environments. Referring to the 3D image in figure 9, we see the exact location where CMSR-2 intersects the SBP example section. We observe that where the lines intersect, the low velocity marine sediments are 20 m thick. So why has the CMSR line only mapped down to a thickness of 5 m? This is a good example where presentation of CMSR results becomes somewhat complicated and potentially misleading.
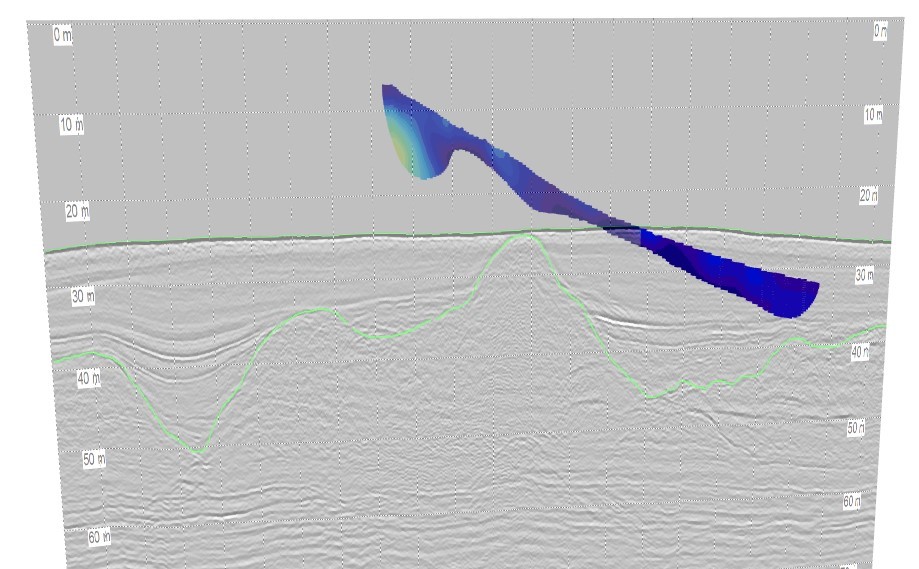
Figure 9. 3D view showing interception of the SBP and CMSR-2 sections.
The shallow thickness of the interpretation is not a direct indication of the depth of investigation of the CMSR methodology. It is an indication of the depth of the seismic ray paths calculated by the tomographic inversion, required to fit the field data at this location. Vp data is only assigned where ray paths occur, and the model is blanked where Vp values can’t be reliably assigned.
Depth of investigation is strongly dependent on the distance from the airgun to the furthest channel and the sub-seafloor Vp structure. Typically, where deep sequences of lower velocity structures occur, larger survey geometries are required to achieve refracted arrivals. The Surrich streamer is therefore estimated to achieve refraction models ranging from about 20 to 40 m deep, provided the vertical velocity profile increases in these levels. When practitioners provide Vp profiles with ‘constant-depth’ these are without consideration to the ray paths required to derive the model. Model extrapolation to the extent of the section should not be mistaken for reliable model results and may be misleading.
This example demonstrates how thick marine sediments and/or low Vp bedrock geologies tend to reduce the apparent usefulness of the CMSR method. In this same environment SBP can yield spectacular results. However, close to the shoreline, factors such as shallow water, sloping seabed or coarse sediments can degrade the SBP results, and in this scenario CMSR may provide the only reliable source of data.
CMSR-5 (lower profile, figure 8) was acquired in shallow water, immediately adjacent to shore. Figure 10 shows the two intercepting CMSR lines in 3D with an additional SBP example perpendicular to the shoreline. Digitizing the base of the marine sediments fails approaching the shoreline with the interface becoming lost in shallow clutter reflections in the SBP section, however the CMSR Vp profile continues to provide additional rock properties close to the shoreline. The 3D view in figure 10 also indicates the presence of a distinct horizontal SBP reflector within the sedimentary bedrock which corresponds to increased Vp. This reflector, although one of many, has now been identified as being geotechnically significant and deserves consideration when planning the drilling program.
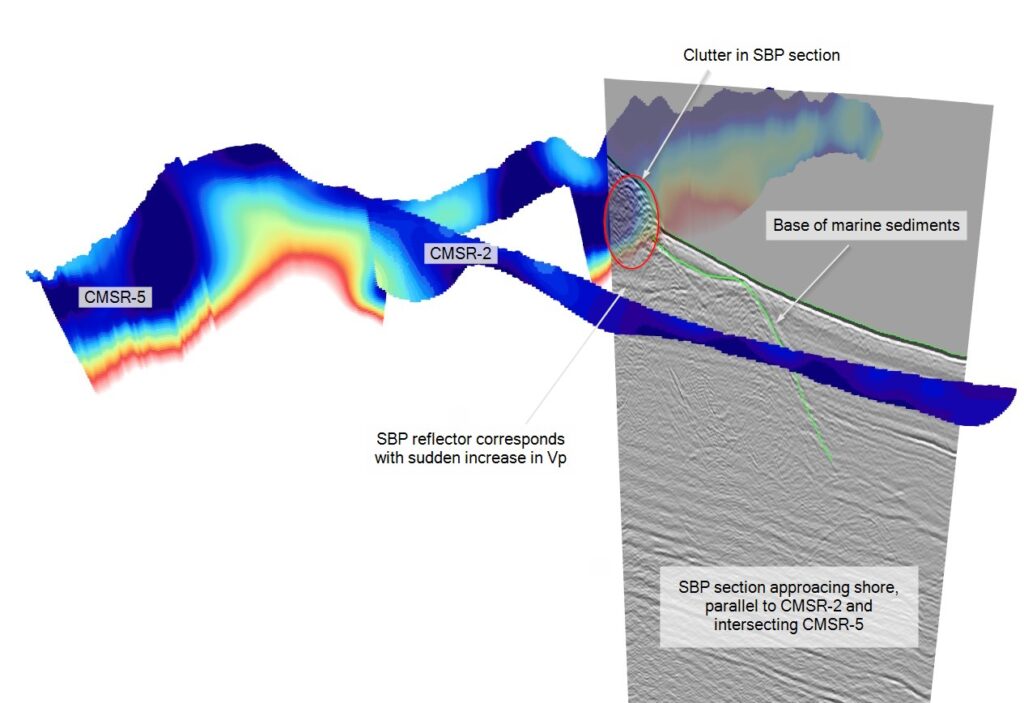
Figure 10. 3D view showing interception of the CMSR sections and an additions SBP section approaching the shoreline.
In conclusion, while the CMSR methodology may be perceived as having lower value in this low-velocity environment, we have demonstrated it continues to provide important information.
Conclusions
We have demonstrated the benefits of jointly acquiring SBP and CMSR. CMSR provides additional useful information over SBP Boomer in a geotechnical context because:
- Applying a specific geological interpretation to SBP reflectors may result in gross errors which may be assessed when CMSR is jointly acquired.
- The calculated Vp section is a function of the elastic rock properties and does not rely on a subjective interpretation.
- The Vp section is unaffected by coarse sediments and shallow waters which can strongly limit the penetration of SBP Boomer results on coastal projects.
Finally, we have also shown that advanced SBP processing methodologies can be useful for improving results in shallow costal projects.
Author Bio

Justin has been a co-owner of Australian company Surrich Hydrographics since 2012, where they concentrate on coastal hydrographic and geophysical projects. Justin leads the geophysical projects while business partner Andrew Richardson leads the hydrographic survey projects.
Justin has a BSc in Geophysics from Curtin University in 1993, performing near surface geophysical projects throughout his career from land, sea and air. [email protected]
