
By Ahmed Lachhab1 and Charles Braught1
1Susquehanna University
Abstract
Ground Penetrating Radar (GPR) has emerged as a highly effective method for waterborne subsurface investigations, providing accurate results without causing negative impacts. This study utilized GPR to survey Halfway Like, a manmade reservoir located in Mifflinburg, Pennsylvania. The investigation focused on obtaining detailed bathymetry, sub-bathymetry, and sediment volumes within the lake. A 400 MHz transceiver was employed to perform 71 survey profiles, covering the entire reservoir. To assess the water volume and the total sediment load, contour maps of bathymetry and sub-bathymetry were generated respectively. For all surveys, a custom-designed GPR apparatus was constructed on a two-person inflatable raft, equipped with a sub-metric GPS and a 400 MHz antenna. The collected data was processed using mapping software, to generate contour maps and 3D models of the site and provide detailed information about the lakebed. In an intense literature review on radar wave velocities through saturated lakebed sediment, like that of Halfway Lake, a value of 0.0762 m/ns was found. The sediment volume was calculated to be 7897.224 m³, while water volume was calculated to be 19704.963 m³. The sedimentation rate over the last 100 years has been also estimated to be approximately 87.747 m³/year. Moreover, the survey profiles reveal the original stream channels of both Rapid Run and Halfway Run. At the point where the two stream channels originally met, the reservoir reaches its greatest depth, measuring 2.5 m. Lastly, the survey profiles display a notable difference in sediment types, with sand accumulation on the beach side and naturally occurring organic sediment in the deeper parts of the reservoir.
Introduction
The sediment pollution in the Chesapeake Bay poses a significant concern due to its numerous harmful effects. Elevated sediment levels cause increased turbidity, which limits light penetration and reduces primary production. The excess nutrients in sediments also lead to algal blooms which results in lower levels of dissolved oxygen (DO) in water (Lutgen et. al., 2020). Furthermore, once algae die, they are decomposed by bacteria which further decrease DO in water. Long-term trends have determined that sediment loads into the Chesapeake Bay from its largest watershed, the Susquehanna River, are increasing (Chesapeake Progress, 2020). Great efforts to combat sedimentation on the Upper Bay have yet to be proven successful as the best management practices are widely debated (Noe et al., 2020). Currently, the focus in the Susquehanna River drainage basin is on targeting anthropological impacts, primarily those caused by farms, to address the issue of sedimentation. Outreach and education programs such as installing riparian buffers to catch sediments before entering waterways has been successful. However, the problem of sedimentation remains persistent. One possible solution to limit sediment loads in the Chesapeake Bay, which warrants investigation, is perhaps the construction of multiple upstream sediment-catching reservoirs. Trapping sediment upstream in a series of reservoirs can reduce sedimentation downstream. Nevertheless, this approach may still lead to various localized environmental issues arising from sedimentation (Kondolf, 2014).
Recent research has extensively documented the impacts of sedimentation on man-made reservoirs (Lachhab, 2021, 2015, 2018; Brown et al., 1944; Dai and Liu, 2016). Localized sedimentation on existing reservoirs is not a viable management practice as it still poses environmental issues and becomes a major threat during severe storms when sediment is transported downstream (Brown et al, 1947). However, strategically engineering reservoirs to collect large sediment volumes remains theoretically effective (Bennett and Buck, 2016). Proper accumulation of sediments from human activities is crucial to prevent downstream risks, particularly in critical areas like the Chesapeake Bay. To monitor sedimentation effects on existing reservoirs, measuring the volume and sedimentation rate can be achieved using Ground Penetrating Radar (GPR).
GPR has been utilized as a non-intrusive geophysical method to investigate a variety of subsurface anomalies, such as underground utilities, building foundation, geology, and karst formations. More recently, it has been employed in lakes surveys for bathymetry and bottom sediment deposits. The method relies on the contrasting electromagnetic properties of water and sub-bottom sediment layers to achieve successful lake surveys (Moorman and Michel, 1997; Petrone, 2013 and 16; Dupont-Andrew, 2022; Brosten et al., 2006; Davis and Annan, 1989; Lin et al., 2009; Zarroca et al., 2017). In these methods, the antenna transmits EM radar waves, and a receiver records the signals reflected from physical objects having different dielectric constants. By recording the Two-Way Travel Time (TWTT), which is the time taken by the electromagnetic waves to travel back and forth between the transmitter and the various discontinuities, GPR enables the mapping of bathymetry and the sub-bathymetry interfaces. The GPR survey method offers several advantages, particularly its ability to collect numerous data points accurately and in a well-timed manner across the entire lake.
Halfway Lake, in Raymond B. Winter State Park, Union County, Pennsylvania, was selected as the experimental site for this study. Halfway Lake receives water from spring-fed mountain streams and is contained by a hand-laid, native sandstone dam that was constructed in 1933. A custom-made GPR apparatus, including a 400 MHz transceiver, a GPR controller, and a global positioning system (GPS) device was used. These components were mounted on a small 2-person crewed inflatable watercraft. The data collected from this GPR survey was utilized to calculate both the water volume and sediment volume in the lake. The sediment volume was determined by considering the depth to bathymetry (topography of lakebed) and the depth to the bottom of the sediment layer (sub-bottom or sub-bathymetry interface). Ultimately, a 3D model of the entire lake was created by compiling all 2D individual GPR profiles collected during the survey.
Study site
Halfway Lake is located within the Chesapeake Bay watershed in R. B. Winter State Park, Mifflinburg, Pennsylvania (Figure 1). The dammed reservoir was constructed in 1933 using hand-laid, native sandstone with a single spillway. This lake is a recreational spot, offering activities such as swimming, fishing, and other water activities. The lake is nested in a valley protected by ridges covered with oak and pine forest. Water from the reservoir flows into Rapid Run which in turn flows into Buffalo Creek. Ultimately, Buffalo Creek joins the Susquehanna River, which is the largest tributary to the Chesapeake Bay.
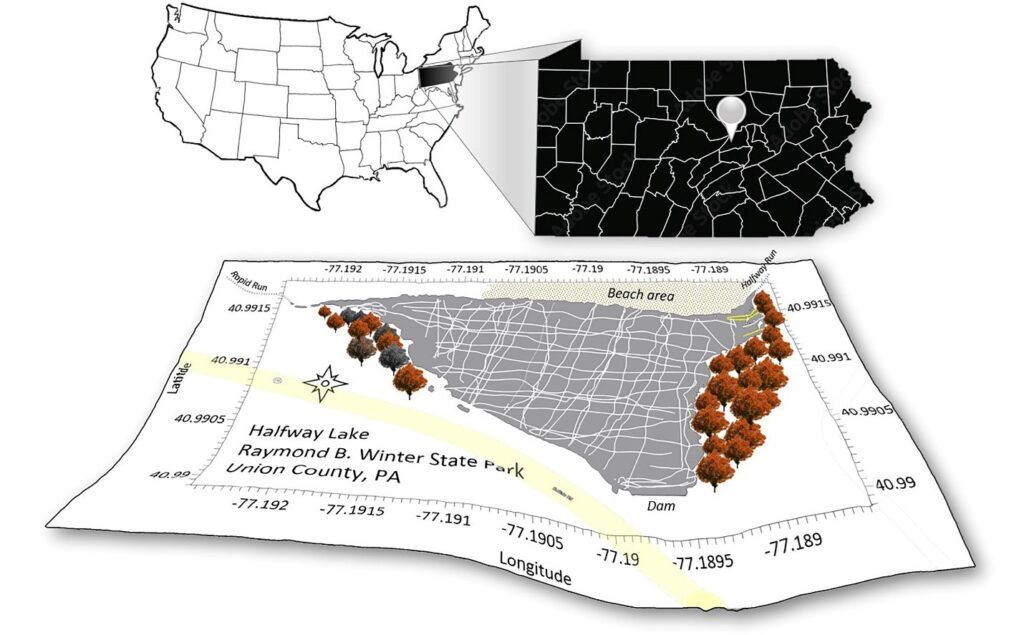
Figure 1. Location of Halfway Lake in Raymond B. Winter State Park, Union County, Pennsylvania. The white lines on the lake represent the GPR survey profiles.
Methods
Halfway Lake was chosen for the GPR survey due to its manageable size and depth. A two-person inflatable boat was chosen for its non-radar obstructing material, ability to protect the antenna, and capacity to accommodate the size of the reservoir. The antenna was securely placed in the middle of the boat at the bottom, ensuring perfect coupling with the water. Both passengers used oars for manual navigation during the survey because powered boats are prohibited in this lake. In shallower and less navigable areas, such as where Rapid Run and Halfway Run enter the reservoir, the apparatus was manually pushed to acquire additional data. A 400 MHz transceiver from Geophysical Survey Systems Inc (GSSI) was chosen due to the shallow nature of the lake, as indicated by the information obtained from the Pennsylvania Department of Conservation and Natural Resources (DCNR). The 400 MHz antenna was particularly suitable for the depth ranges, which ranged from 0 and 2 meters, and it could extend its reach to 3 meters for sub-bathymetric exploration. The GPR apparatus consists of a GSSI SIR 4000 GPR controller mounted on a wooden plank placed across the boat, along with a Juniper Systems Global Positioning System (GPS) called GeodeTM GNS3S GPS/GLONASS receiver, offering sub-metric accuracy. All these components were mounted on a small watercraft (Figure 2).
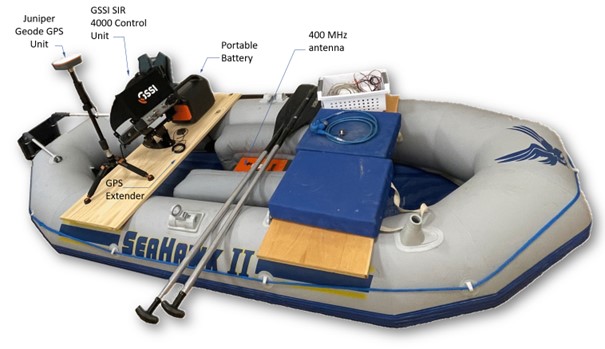
Figure 2. Custom-made GPR apparatus used to survey halfway lake.
All GPR transects were surveyed in time mode, adhering to the assigned parameters outlined in Table 1, while maintaining a consistent depth range between 2 to 3 meters. A total of 71 radargrams were collected during two separate site visits. Specifically, radargrams 1 to 44 were collected on 2/21/2023, while radargrams 45 to 71 were collected on 3/3/2023. Subsequently, the 71 radargrams were processed, resulting in 13,324 data points, which were used to generate the bathymetry map, and 9,808 data points, which were used to generate the sub-bathymetry map. The main objective of this process was to obtain evenly dispersed data points to cover all the features of the entire lakebed (Figure 4). Each individual data point includes GPS coordinates, along with depth measurements for both bathymetry and sub-bathymetry. The total sediment volume of Halfway Lake was calculated using the two-way travel time (TWTT) of all radar waves through both water and saturated sediment, using the following expression:
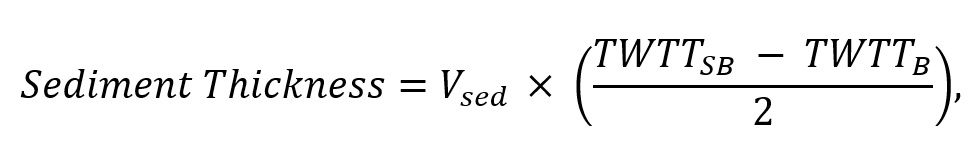
where Vsed is the propagation velocity of the radar wave within the lakebed sediment, TWTTB and TWTTSB are, respectively, the two-way travel times of the radar wave emitted from the GPR transceiver, reflected off the bathymetry and off sub-bathymetry boundaries and are then received by the transceiver to be recorded in nanoseconds. In this study, both the dielectric constant and propagation velocity of water and sediment were extracted from literature (Table 2). The dielectric constant of freshwater was assumed to be 80 with a propagation velocity VWater=0.0335 m/ns (Davis and Annan (1989), Daniels (1996), Moorman and Frederick (1997), and Glaser et al (2012) and the dielectric constant of sediment was estimated to be 16 with a propagation velocity in submerged fully saturated sediment of Vsed=0.0762 m/ns (Brosten et al., 2006; Davis & Annan 1989; Lin et al., 2009; Zarroca et al., 2017). The study’s workflow is succinctly depicted in Figure 3.
Table 1. SIR 4000 GPR Controller data collection parameters.
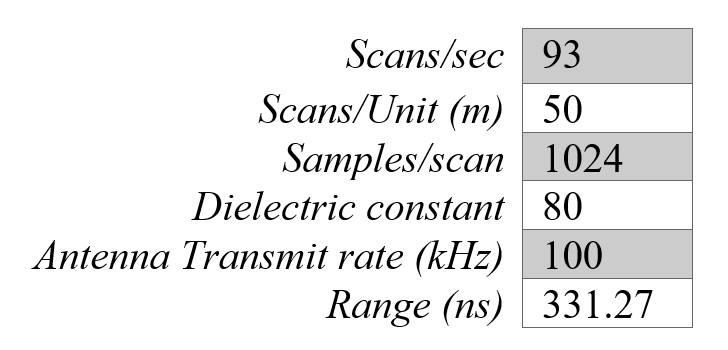
Table 2. Compiled radar wave velocities in fully submerged saturated materials.
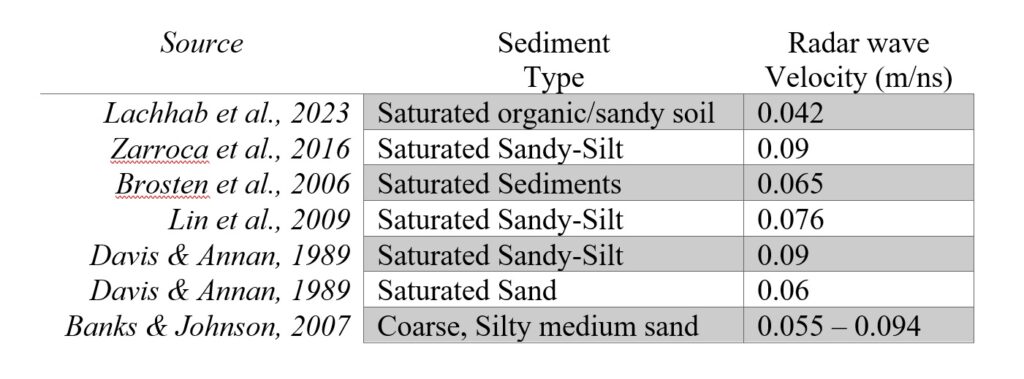
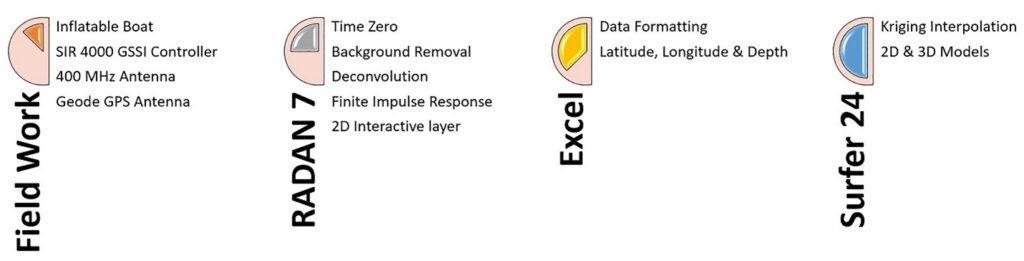
Figure 3. workflow diagram showing all the steps followed in this study.
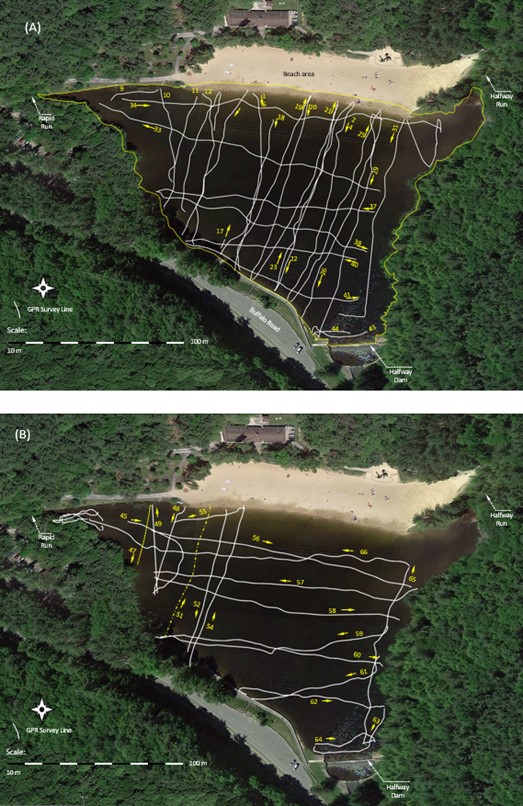
Figure 4: The two GPR surveys of Halfway Lake, performed in (A) 2/21/2023 to collect transects 1-44 and in (B) 3/3/2023 for transects 45-70 (B).
Data Processing
All radargrams were processed with RADAN 7, a software developed by GSSI. To begin the processing, specific steps were necessary to enhance the identification of bathymetry and sub-bathymetric layers on the radargram profiles. These steps included: 1) zeroing the water level for reference to determine any changes in the lake’s depth, 2) removing the background, 3) adjusting the range gain to enhance the detection of the reflections from these two boundaries, 4) improving the quality of certain radargrams using the deconvolution technique, 5) performing a finite impulse response (IIR) filtering to reduce noise and enhance reflection zones of the two boundaries, and 6) scaling these radargram profiles horizontally to fit entirely in the computer screen (43 inches monitor). RADAN-2D interactive interface was then used to select target points for both the bathymetry and the sub-bathymetric boundaries. The processed radargrams provided data files ranging from 50 to 350 strings, each containing latitude, longitude, and depth depending on their sizes. These files, obtained in Comma Separated Values (CSV) format, were later opened in Microsoft Excel to be separated into distinct columns, facilitating a seamless transfer to SURFER 21 (Golden Software, LLC). SURFER 21 was used to create a comprehensive 3D model contour map and allowed the determination of the water volume using one of the three available approaches: Simpson’s rule, Simpson’s 3/8th rule, or the trapezoidal rule. These approaches establish mathematical techniques that provide reliable estimations of water volume within the investigated data. The sediment volume was calculated based on the difference between the volume of the water estimated using the current bathymetry and the volume of water estimated using the sub-bottom interface corresponding to the 1933 topography of the lake prior to its construction. This difference was then adjusted in accordance with the corresponding velocity value within the sediment material found in the literature, as summarized in Table 2.
Results and Discussion
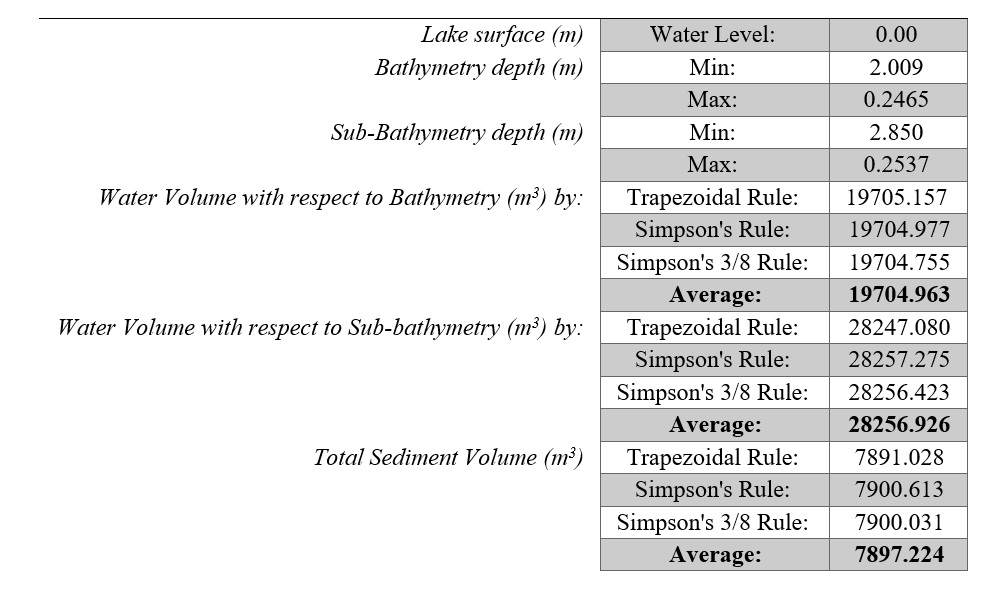
The analyses of 28,528 data points obtained from the GPR investigation was used to create both 2D and 3D models of Halfway Lake. These models revealed that the maximum depth of Halfway Lake’s bathymetry is 2.05 m, while the maximum depth of the sub-bathymetry was found to be 2.923 m. The deepest point within the lake was located near the dam, while the shallowest areas were identified in three locations: the inlets of the two streams, the area confined between them, and the northern side near the beach area (Figure 5). The original stream channels for both Rapid and Halfway Runs were visible in the radargrams and recognizable in both the bathymetric and sub-bathymetric layers. Evidence of seasonal shifting of sand from the beach area and accumulation in an area situated at 25-30 m from the shoreline was also noticeable in the radargrams. As confirmed by park officials, to mitigate this phenomenon, the water level is intentionally drained 4 to 5 feet below the actual water level every 3 to 4 years, and the sand is pushed back to replenish the beach area (Figure 6 and 7). The total sediment volume of Halfway Lake was estimated to be 7897.224 m³ (Table 3). Table 3 summarizes all the findings of the most important physical aspects of the lack survey using the three numerical integration methods used to approximate the value of a definite integral. The trapezoid rule calculates the area under a curve by approximating it with a trapezoid, while Simpson’s rule uses a parabola and Simpson’s 3/8 rule, the extension of Simpson’s rule that uses cubic polynomials to approximate the curve. Since the construction of the reservoir in 1933 the average rate of sedimentation is estimated to be 87.747 m³/year. Presently, 28% of the total water storage within the reservoir has been lost due to sedimentation within the basin since 1933.
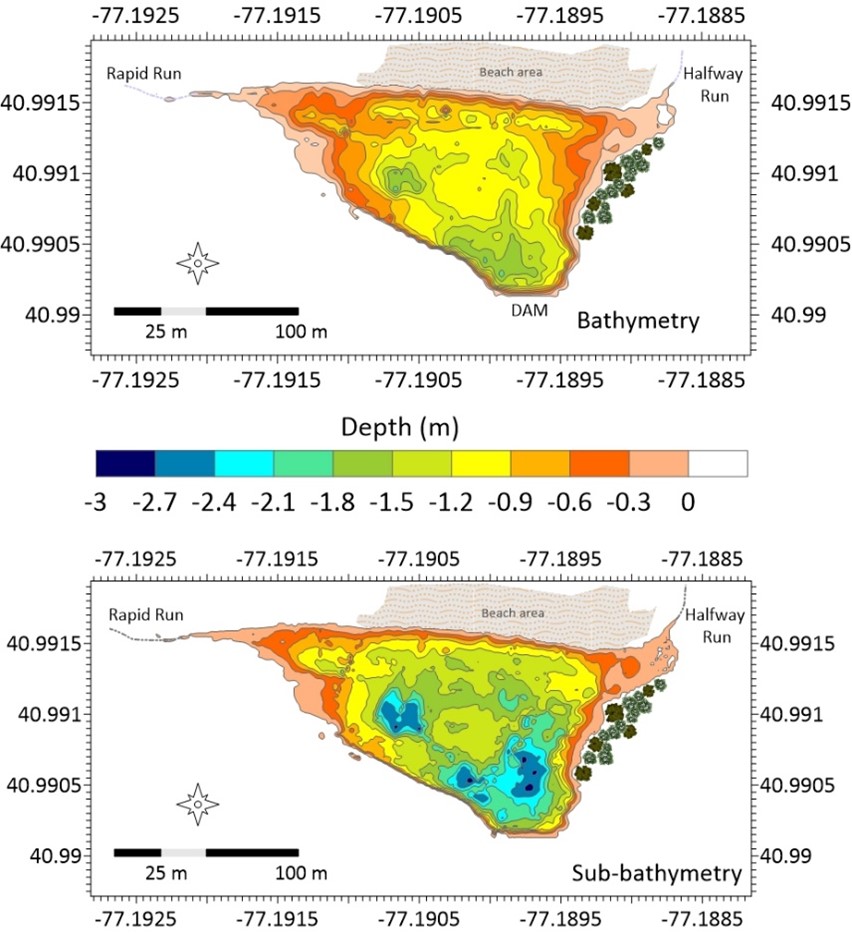
Figure 5: Bathymetry and sub-bathymetry of Halfway Lake.
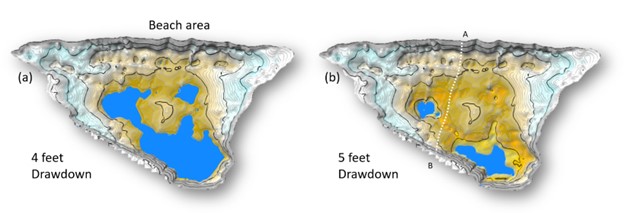
Figure 6: Two scenarios of water drawdown for beach maintenance, (a) water is dropped 4 feet and (b) water is dropped 5 feet. The white dash line A-B represent a GPR survey line shown in figure 7.
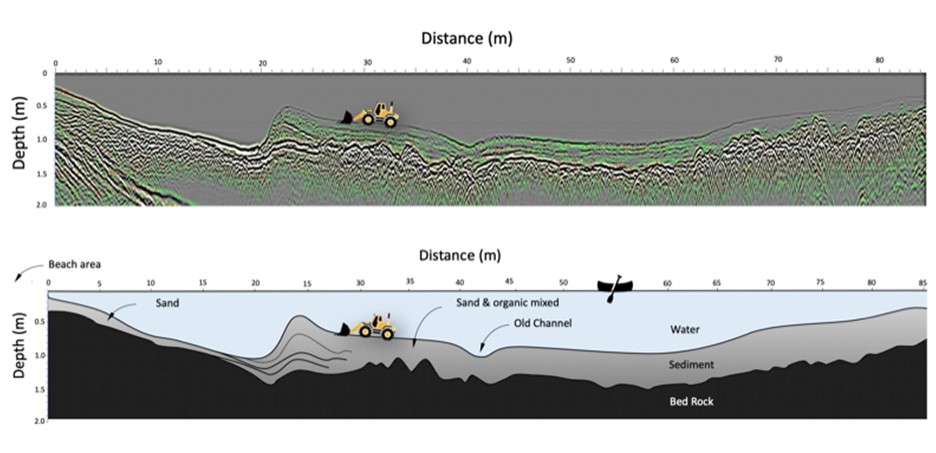
Figure 7: Radargram of profile A-B (shown in figure 6) and schematic illustration of sand shifting and accumulation 25-30m from the beach shoreline.
Table 3. Summary of all important physical findings of Halfway Lake using the three numerical integration methods: The trapezoid rule, Simpson’s rule, and Simpson’s 3/8 rule.
Conclusions
This study has provided a methodology for waterborne GPR bathymetric and sub-bathymetric investigations as well as details on the sediment accumulation rate in Halfway Lake, Winter State Park, Pennsylvania. Utilizing a custom-made apparatus, 28,528 data points were collected across the entire reservoir. Contour maps of both bathymetry and sub-bathymetric were created to visualize the submerged stream channels of Rapid and Halfway Run as well as the seasonal impacts of the man-made beach on the north side of the lake. Total sediment volume was estimated to be 7897.224 m³ which is 28% of the total lake volume. With the construction of the sandstone dam in 1933, this provides a rate of sedimentation to be 87.747 m³/year. The maximum depth of the lake is 2.05 m and located directly above the western side of the dam, while the maximum depth of the sub-bathymetry was found to be 2.923 m.
References
Banks, W.S. and Johnson, C.D., 2011, Collection, processing, and interpretation of ground-penetrating radar data to determine sediment thickness at selected locations in Deep Creek Lake, Garrett County, Maryland, 2007. Washington, DC, USA: US Department of the Interior, US Geological Survey.
Bennett, K.D., and Buck, C.E., 2016, Interpretation of lake sediment accumulation rates. The Holocene, 26(7), pp.1092-1102.
Brosten T.R., Bradford J.H., McNamara J.P., Zarnetske J.P., Bowden W. and Gooseff M.N. 2006. Profiles of temporal thaw depths beneath two arctic stream types using ground-penetrating radar. Permafrost and Periglacial Processes 17, 341–355
Brown, C.B., 1944. The control of reservoir silting (No. 521). US Department of Agriculture.
Brown, C. B., and Thorp, E. M., 1947, Reservoir sedimentation in the Sacramento-San Joaquin drainage basins, California, U.S. Department of Agriculture, Soil Conservation Service Report No. 10, 69 p.
Dai Y., Yang YY., Wu Z., Feng QY., Xie SG., Liu Y., 2016, Spatiotemporal variation of planktonic and sediment bacterial assemblages in two plateau freshwater lakes at different trophic status. Appl Microbiol Biotechnol 100:4161–4175
Daniels, D.J., 1996, Surface-penetrating radar – IEE radar, Sonar, Navigation and Avionics Series 6: London, The Institute of Electrical Engineers, 320 p.
Davis, J. L., and A. P. Annan., 1989, Ground-penetrating radar for high- resolution mapping of soil and rock stratigraphy. Geophysical Prospecting. 37:
531-551.
Dupont-Andrew, T., 2022, GPR with a Bench Model Experiment to Measure Bathymetry and Sediment Accumulation of Faylor Lake, Pa (thesis).
Glaser, D.R., Werkema, D.D., Versteeg, R.J., Henderson, R.D., and Rucker, D.F., 2012, Temporal GPR Imaging of an Ethanol Release within a Laboratory-Scaled Sand Tank: Journal of Applied Geophysics, 86, 133–145.
Kondolf, G. M., 2014, Sustainable sediment management in reservoirs and regulated rivers: Experiences from five continents, Earth’s Future, 2, 256 – 280, doi:10.1002/2013EF000184.
Lachhab, A., Trent, M. M., and Motsko, J., 2021, Multimetric approach in the effects of small impoundments on stream water quality: Case study of Faylor and Walker Lakes on Middle Creek, Snyder County, PA: Water and Environment Journal, 35(3), 1007-1017.
Lachhab, A., Booterbaugh, A., and Beren, M., 2015, Bathymetry and Sediment Accumulation of Walker Lake, PA Using Two GPR Antennas in a New Integrated Method: Journal of Environmental & Engineering Geophysics, 20(3), 245-255.
Lachhab, A., and Sharer, M., 2018, Bathymetry and Sediment Accumulation of Faylor Lake, PA Using a Newly Updated Assembled GPR Apparatus: SAGEEP, EEGS and NGWA, Nashville, TN. (March 28, 2018).
Lin, Y. T., Schuettpelz, C. C., Wu, C. H., & Fratta, D., 2009, A combined acoustic and electromagnetic wave-based techniques for bathymetry and sub bottom profiling in shallow waters (thesis). Journal of Applied Geophysics.
Lutgen, Jiang, G., Sienkiewicz, N., Mattern, K., Kan, J., & Inamdar, S., 2020, Nutrients and Heavy Metals in Legacy Sediments: Concentrations, Comparisons with Upland Soils, and Implications for Water Quality. Journal of the American Water Resources Association, 56(4), 669–691. https://doi.org/10.1111/1752-1688.12842
Moorman, B. J., and Frederick A. M., 1997, Bathymetric Mapping and Sub-Bottom Profiling through Lake Ice with Ground-Penetrating Radar: Journal of Paleolimnology, 18(1), 61–73.
Noe, G.B., Cashman, M.J., Skalak, K., Gellis, A., Hopkins, K.G., Moyer, D., Webber, J., Benthem, A., Maloney, K., Brakebill, J. and Sekellick, A., 2020, Sediment dynamics and implications for management: State of the science from long‐term research in the Chesapeake Bay watershed, USA. Wiley Interdisciplinary Reviews: Water, 7(4), p.e1454.
Petrone, J., 2013, Using ground-penetrating Radar to Estimate Sediment Load in and Around Two Boat Lake, Western Greenland (Dissertation). http://urn.kb.se/resolve?urn=urn:nbn:se:uu:diva-196291
Petrone, J., Sohlenius, G., Johansson, E., Lindborg, T., Näslund, J.O., Strömgren, M. and Brydsten, L., 2016. Using ground-penetrating radar, topography and classification of vegetation to model the sediment and active layer thickness in a periglacial lake catchment, western Greenland. Earth System Science Data, 8(2), pp.663-677.
Water quality standards attainment and monitoring. Chesapeake Progress. (n.d.). https://www.chesapeakeprogress.com/clean-water/water-quality
Zarroca, Comas, X., Gutiérrez, F., Carbonel, D., Linares, R., Roqué, C., Mozafari, M., Guerrero, J., & Pellicer, X. M. (2017). The application of GPR and ERI in combination with exposure logging and retrodeformation analysis to characterize sinkholes and reconstruct their impact on fluvial sedimentation. Earth Surface Processes and Landforms, 42(7), 1049–1064. https://doi.org/10.1002/esp.4069
Authors’ Bios

Ahmed Lachhab
Dr. Lachhab holds a M.S. in Geophysics, an M.S. in Civil and Environmental Engineering and Ph.D. in Groundwater Hydrology. He combines techniques from both hydrology and geophysics to conduct comprehensive studies on aquifer heterogeneities and their contamination. Additionally, Dr. Lachhab specializes in Surveying Lake bathymetry and assessing sediment loads in dams, providing valuable insight into the morphology of water bodies and aiding in effective reservoir management. lachhab@susqu.edu
Charles Braught
Charles Braught earned a Bachelor of Science degree in Earth and Environmental Sciences from Susquehanna University. His research in geophysics is centered around surveying lake bathymetry and studying sediment deposits in man-made reservoirs. Presently, he serves as a geoscientist at RITTEW Associates, Inc. braught@susqu.edu
