
By Eliezer Ramos1
1Tesolum Exploration, Chihuahua, Chihuahua, Mexico
Introduction
The rapid increase in agricultural and urban areas has generated a greater demand for groundwater, increasing scarcity in Mexico’s principal aquifers. This challenge generates a greater degree of difficulty in achieving higher production wells. Under this precedent, it is necessary to know the project’s geology as a fundamental axis in characterizing the units in the subsoil. Given the need to know the geological unit’s geometric arrangement, it is crucial to identify the types of rock that constitute them, their structures, and physical properties (density, electrical resistivity, wave propagation speed, etc.) as support mechanisms in the cartographic characterization of a region. The main goal was to find groundwater-bearing fractures that could be drilled for water well.
Geological Background
The local geology constitutes a volcanic sector in the mountains of Sinaloa. It has a river that flows only during the rainy season, but during the long dry outs that have been present, water has to be transported from other sources. Several NW-SE-trending normal faults cut the volcanic rocks. Figure 1 shows a simplified geological map with the survey areas.
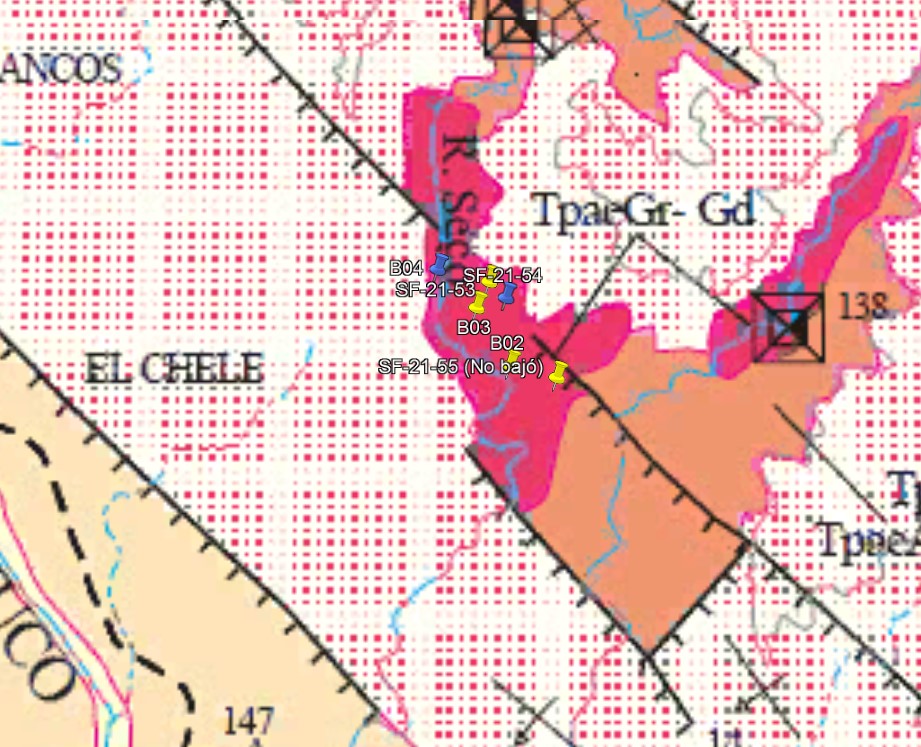
Figure 1. Local Geology.
Exploration Strategy
The project’s initial phase is to acquire coordinates and information from all the core drills available in the zone (Figure 2). The project is located in a mining company with more than 100 core drills. Hence, the following steps were taken:
- Determine which of the core drills had water and were still accessible to run gamma ray and resistivity log
- Select the best log that shows larger permeable zones
- Using the best logs, use 2D Electrical Resistivity Tomography (ERT) to confirm the data and investigate deeper
- Correlate wireline log, ERT, and core samples to confirm all the data and select the best spot and depth to drill
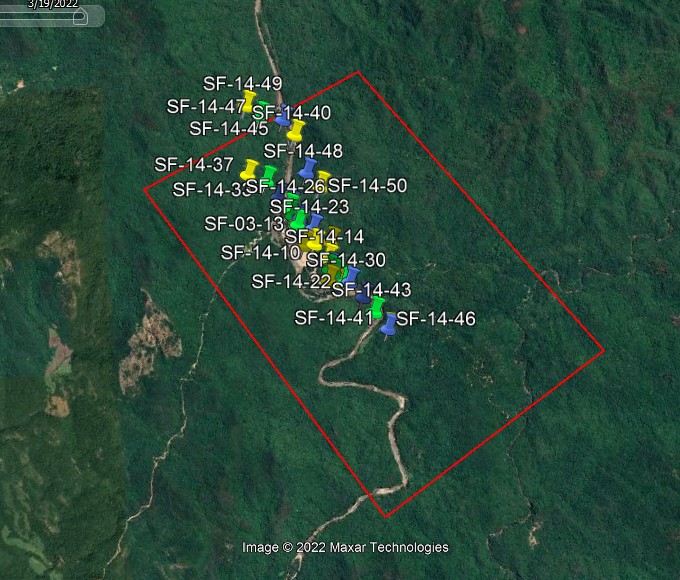
Figure 2. All available core drills.
Wireline Logs
We ran wireline logs in all the wells that had water. The wireline log SF-21-54 is the best example (Figure 3); because it has the largest and best fracturing conditions and correlates with the ERT D3.
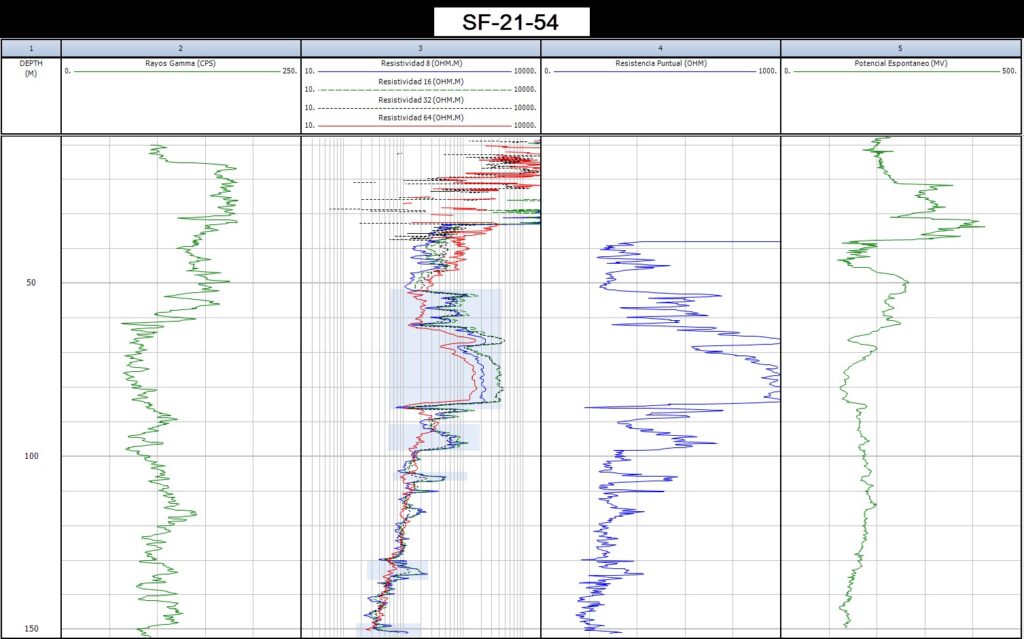
Figure 3. Wireline log SF-21-54.
2D ERT Survey
Based on the wireline logs information, the 2D ERT distribution was selected. Figure 4 depicts the resulting 2D ERT layout, consisting of eleven (11) ERT profiles trending NE-SW. The SuperSting R1/IP resistivity meter with 56 electrodes with long (27-m) electrode spacing was used to collect electrical resistivity data. The data was acquired with the dipole-dipole electrode array. The EarthImager 2D software was used to invert, visualize, and interpret the resistivity data. Elevation along each profile was considered and applied for topographic correction in the 2D inversion.
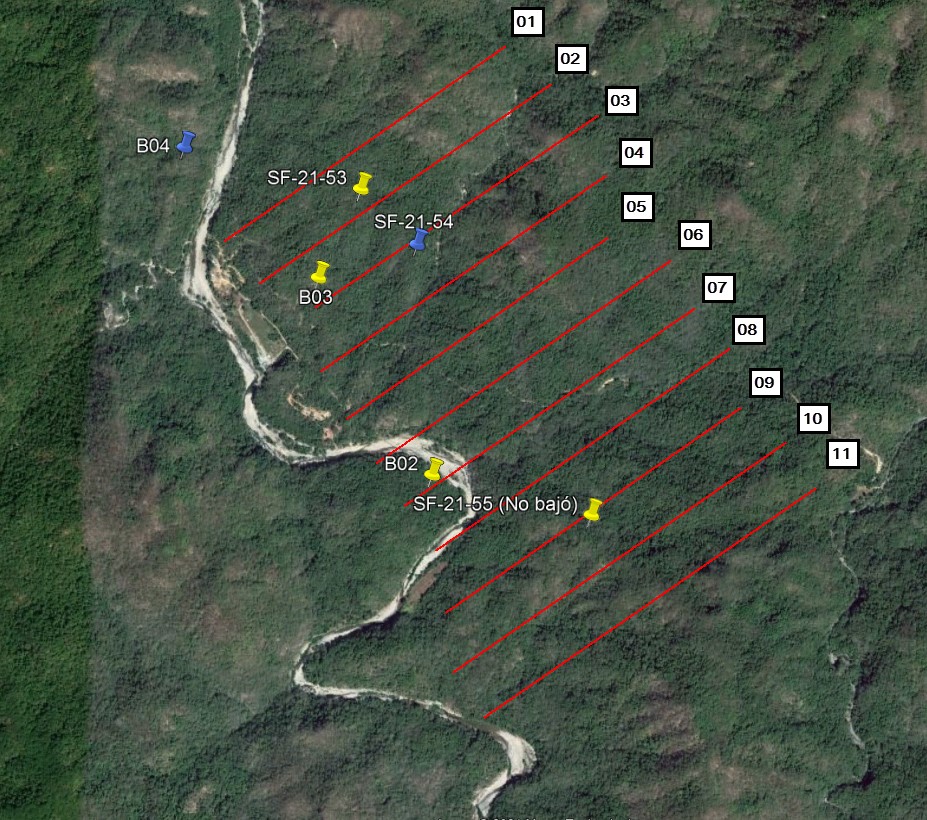
Figure 4. 2D ERT survey layout.
Results And Interpretation
The 2D ERT survey, coupled with the available drill core and wireline logs, provided excellent insights that support the potential of groundwater in the fractured volcanic rocks. Table 1 shows the most crucial electrical resistivity ranges, the values in blue in the range of 20 to 100 ohm-m support the best conditions to drill for groundwater.
Then geophysical data correlates well with the core samples provided by the mining company; these core samples show the following: (1) solid rock at high electrical resistivity values; (2) contact with the intrusive rock; and (3) highly-fractured rock where the 2D ERT yields low electrical resistivity readings. Figure 5 shows an example of the different rock fracture conditions in the project area.
For instance, the 2D ERT line D3 provides an excellent example of the resistivity survey aided by the drill core samples and the wireline logs. The D3 line correlates well with the wireline log SPF-21-54, which shows low resistivity readings at the depth that the wireline log shows fractures. Figures 6 and 7 show the 2D ERT D3 and the interpretation, respectively.
Table 1. Electrical resistivity ranges and interpretation based on the present 2D ERT survey, drill cores, and wireline logs.
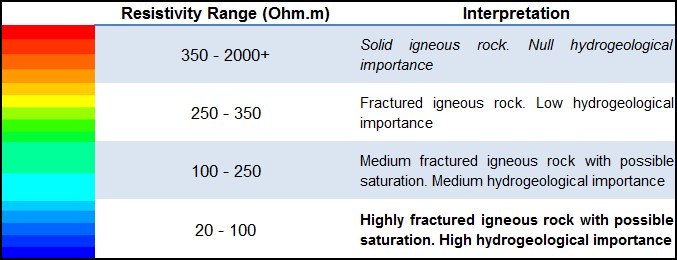
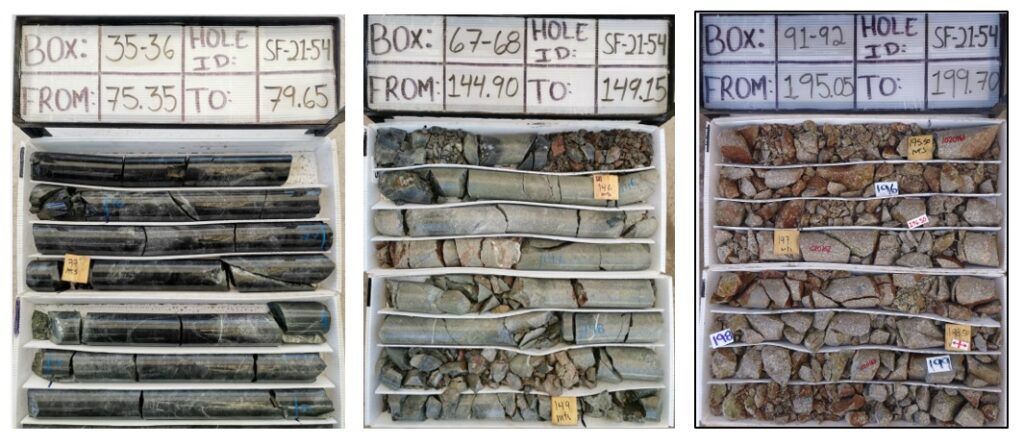
Figure 5. Core samples show different rock fracture conditions: null fractured zone (left), medium to high fractured zone (middle), and highly fractured zone (right).
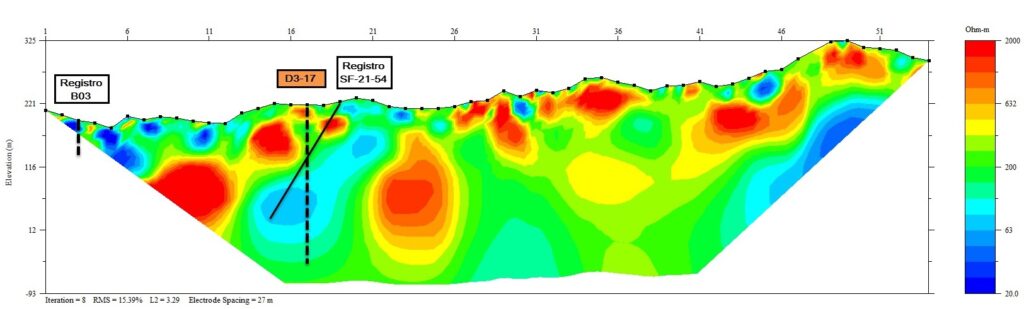
Figure 6. 2D ERT of line D3. A close-up of its interpretation is shown in figure 7.
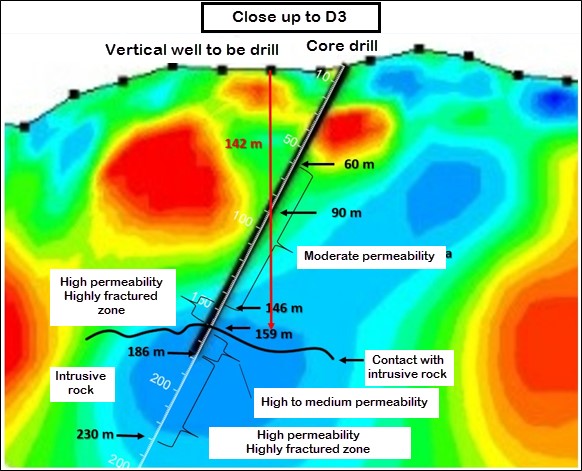
Figure 7. Interpretation of the line 2D ERT D3 is shown in figure 6.
Conclusions
Wireline log, 2D ERT, and the images of the fractured core samples correlate with each other in support of groundwater potential. If this information is available, it provides ideal conditions to drill a water well to secure future water supply for the mining company. Mining companies should take advantage of their available core drills that can be studied using proper geophysical technology to secure future water supply or to find where the water is coming from to avoid flooding. Geophysical data can be a great tool to predict permeable zones and help to be more efficient within mining operations.
References
KEAREY, P.; BROOKS, M.; HILL, I. An Introduction to Geophysical Exploration. Third edition. London: Blackwell Science, 2002. ISBN 0-632-04929-4
KIRSCH, R. Groundwater Geophysics. Second edition. Hamburgo: Springer, 2006. ISBN 978-3-540-88404-0
LOKE, M. H.; BARKER, R. D. (1996). Rapid least-squares inversion of apparent resistivity pseudosections using a quasi-Newton method. Geophysical Prospecting. Volume 44,
ROBERT G MALIVA. Aquifer Characterization Techniques. Editorial Springer. Schlumberger Methods in Water Resources Series No. 4
A. A. KAUFMAN, B. I. ANDERSON. Principles of Electric Methods in Surface and Borehole Geophysics. Editorial Elsevier.
Author Bio
Eliezer Ramos is a Mechanical Engineer with more than 17 years of experience in the oil industry worldwide and the Founder of TESOLUM Exploration. He worked in the Oil Industry in South America, North America, Europe, and the Middle East. Expert advisor on drilling and logging of oil wells worldwide. Teaching and participating in technical courses in the USA, Mexico, Colombia, Aberdeen, and Dubai. Expert member in the development and improvement of resistive technology for well logging. Considered “Subject Matter Expert” in well logging technology. Expert in directional drilling and optimization of offshore and onshore oil wells. Author of 15 technical documents published worldwide within the Weatherford company.
Has run Geophysics for several states of Mexico and South USA. He has done exploration projects for some of the world largest Mining Companies. eramos@tesolum.com
