
Shawn Ryan
Amir Radjaee
Isaac Fage
Chad Cote
Abstract
The nature and distribution of placer deposits are the most unpredictable geological variables in near-surface deposits. Subsurface information about sediment distribution and structure of placer deposits can be obtained either by expensive and destructive techniques like drilling and excavation, or by cost-effective geophysical methods. In this study, coordinated measurements by two complementary geophysical tools, DC resistivity-IP and ground penetrating radar (GPR) were used to map the bedrock surface and sedimentary stratigraphy of placer deposits in variety of exploration sites in Yukon, Canada. The main purpose of this research is the study of stratigraphic discontinuities such as the contacts between sedimentary layers and bedrock, and differentiation of the boulder zones in the creek system. The DC resistivity 2D model and UAV drone imaging data were used to establish the profile of dielectric permittivity for frozen, unfrozen and transitional (thaw) zones along the GPR survey lines, and the results applied in time-to-depth conversion of GPR sections laterally parameterized by a velocity model. Airborne light detection and ranging (LiDAR), which is a method common in mapping small scale geomorphological landforms, helped to identify potential paleochannel systems to validate the interpretation of geophysical sections. Results were compared with known sedimentary stratigraphy and depth to bedrock determined by drilling and shafting. We demonstrate that when combined, these techniques increase the quality and interpretation of subsurface information beyond what could be determined by either of the methods alone. The complementary nature of these two geophysical tools facilitated the detection and mapping of the bedrock surface, possible paleochannels, and basic stratigraphic layers of fluvial deposits favorable to gold deposition target zones.
Introduction
Placer mining means extracting valuable minerals from surface gravel deposits. It differs from hard-rock mining, which refers to mining below the level of solid bedrock. Placer mining activities include mineral exploration, construction of the mine site, and mine operation. To ensure the completeness of overburden excavation, the reduction of mineral losses, and improvement of the overall efficiency of mining operations, the placer miners need reliable information on the geological and mining conditions of field developments. This information helps to determine whether it can be profitably mined as well as calculation of reserves. The geology of a deposit can be defined in part, with surface geophysical investigations. These surveys are intended to measure the depth to bedrock, and to map underlying lithology thickness to determine if any paleochannels favorable to gold deposition could be detected. Geophysical techniques, particularly resistivity methods and GPR are the most common methods to map subsurface permafrost and to link terrain geomorphology to permafrost ice content (Douglas et al., 2016; Navarro et al., 2014; Kulyandin et al., 2016). Electrical resistivity determines the subsurface resistivity distribution and is widely applicable in the study of alluvial deposits, permafrost zones and depth to bedrock. Resistivity techniques work well in regions of permafrost because of the remarkable increase in electrical resistivity of water that occurs at the freezing point. In permafrost regions, resistivity will vary directly as a function of the ice content. Sediments with low ice content typically have low resistivity values, sediments with high ice content will generally have resistivities higher than sediments without ground ice. In areas of weathered bedrock, the mineralogy of the rocks will strongly influence the resistivity values. GPR is another geophysical tool that has been used increasingly over the last years for a wide range of subsurface mapping applications. GPR is based on transmitting an electromagnetic pulse in radar frequency range (between 10 MHz and 3 GHz) into the ground and recording the travel-time of reflections caused by contrasts in dielectric properties at stratigraphic boundaries or diffracted by discrete objects like boulders. Previous studies have shown that GPR data reliably identifies the contacts between frozen and thawed zones in permafrost regions (De Pascale et al., 2008; Douglas et al., 2016).
Data Acquisition and Method
In this study, the field surveys and data collection were conducted during summer 2018 and 2019 in two different placer deposit claims called sites A and B. The ground resistivity, GPR, and UAV imagery data were acquired by GroundTruth Exploration. Boreholes were drilled by GroundTruth Drilling to a depth of 3 to 6 m until they intersected the bedrock. LiDAR Services International (LSI) acquired the LiDAR data.Ground resistivity was measured using the AGI SuperSting system along 84-electrode survey lines. Six cables, each with 14 take-out electrodes were used at 1.5m electrode spacings to achieve a maximum penetration depth into the subsurface of approximately 15m. Inversion modeling of resistivity data were completed using the two-dimensional inversion software RES2DINV (Loke and Barke, 1996; Loke, 1999). Resistivity values of frozen soils are generally 10–1000 times greater than those of unfrozen soils so an excellent marker for permafrost (Harada and Yoshikawa, 1996). The GPR system used was an ABEM MALA GX system with 80 MHz shielded antenna and an integrated DGPS for more accurate positioning. The HDR technology offers fast data acquisition rates with a penetration depth of about 25m at 80 MHz at a radar wave velocity of 0.065 m/ns. The GPR data were processed using the RadExplorer GPR processing software. The radar wave velocity for time-to-depth conversion of GPR sections was estimated based on dielectric permittivity assigned to frozen, unfrozen and transitional zones of permafrost. We have identified these zones from the resistivity model, and when resistivity data are not available, it is estimated from ground vegetation coverage after post-processing of UAV imagery data. Since the change in penetration depth of the GPR signal can vary by more than 30% for different grounds with different radar velocities, it is expected that the accuracy of GPR depth sections improves by applying a lateral velocity model compared to a constant velocity. The vegetation coverage at placer site B from UAV imagery, and high/low vegetation coverage after post-processing of UAV imagery data is shown in Figure 1. In this figure, the resistivity depth slice at 1m below the ground surface plotted on the vegetation map shows a good correlation between resistivity-high with low vegetation (possible permafrost), and resistivity-lows with high vegetation zones.Fluvial sediments and ice content of ground are classified into four groups based on electrical resistivity values extracted
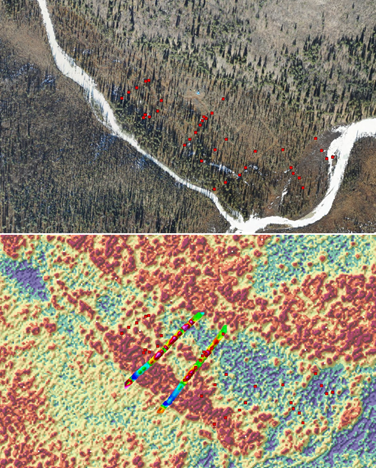
from the resistivity 2D model. Then, a constant dielectric permittivity was assigned to each group. This classification was simplified into three major groups based on vegetation coverage estimated after UAV imagery data post-processing. Estimated dielectric permittivity for GPR depth conversion is presented in Table 1. The depth conversion of GPR data was laterally parameterized along the survey line based on the profile of estimated dielectric permittivity.
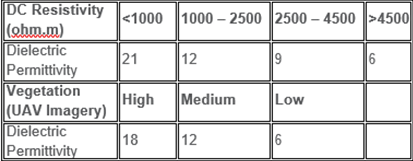
Figure 2 shows the profiles of radar velocity along the GPR lines determined from the resistivity model at site A, and estimated from the vegetation coverage at site B. The vegetation grid is
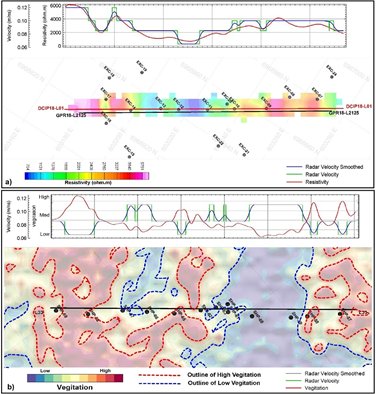
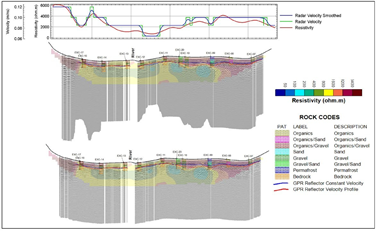
a second-order total derivative product of DSM data from the UAV imagery survey. The GPR depth sections are converted by applying a constant velocity, and the lateral velocity model estimated from DC resistivity are shown in Figure 3. A similar approach has been used by estimation of the velocity model from UAV imagery data. The laterally parametrized sections show a better correlation with drill logs. The axis of buried paleochannels known to affect morphology changes was determined by interpretation of GPR sections
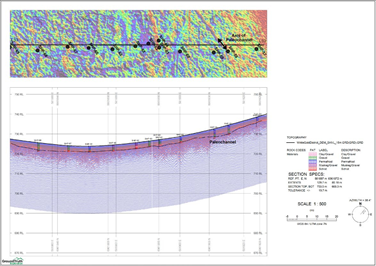
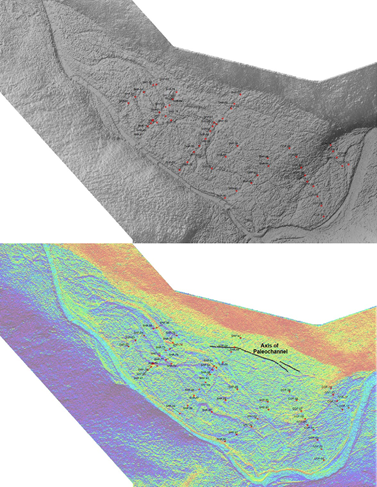
and drill hole data (Figure 4). Then the extension of the interpreted axis of paleochannels is mapped using horizontal derivative products of LiDAR data (Figure 5). The correlation between bedrock topography interpreted from the GPR sections and buried paleochannels identified by the LiDAR is remarkable.
Conclusions
We use resistivity and DSM models in the conversion of GPR depth sections laterally parameterized by a velocity model to detect and map bedrock depth of placer gold deposits. The converted GPR depth sections have been validated with drill holes for the thickness of sedimentary layers and bedrock depth, and with LiDAR data for the paleochannel morphology of placer deposits. The GPR sections, after applying a velocity model, are better matched to the drill hole data. The results confirm that this approach improves the quality of GPR sections and interpretation of the subsurface for fluvial placer deposits in gold deposition target zones. The degree to which this approach is feasible is likely site-dependent and directly influenced by the contrast between dielectric permittivity between different alluvial materials. The approach could also be widely applicable for engineering and environmental projects where similar subsurface information is required.
References
De Pascale J.P., Pollard W.H., Williams K.K., 2008, Geophysical mapping of ground ice using a combination of capacitive coupled resistivity and ground-penetrating radar, Northwest Territories Canada, JGR, 113, F02S90 1-15. Douglas T.A., Torre Jorgenson M., Brown D.R.N, Campbell S.W., Hiemstra S.W., Saari S.P., Bjella K., Liljedahl A.K., 2016, Degrading permafrost mapped with electrical resistivity tomography, airborne imagery and LiDAR, and seasonal thaw measurements, Geophysics, 81, WA71–WA85. Harada K., Yoshikawa K., 1996, Permafrost age and thickness near Adventfjorden, Spitsbergen, Polar Geography, 20, 267–281. Kulyandin G.A., Fedorova L.L., Savvin D.V., Prudetskii N.D., 2016, GPR mapping of bedrock of alluvial gold deposits in permafrost, 16th International Conference of Ground Penetration Radar (GPR).Loke M.H., Baker R.D., 1996, Rapid Least-Squares inversion of apparent resistivity pseudosections by a Quasi-Newton method, Geophysical Prospecting, 44, 1, 131-152. Loke, M. H., 1999. A Practical Guide to 2D and 3D Surveys. Electrical imaging surveys for environmental and engineering studies, A practical guide to 2-D and 3-D surveys. Navarro F.J., Martin-Espanol A., Lapazaran J.J., Grabiec M., Otero J., Vasilenko E.V., Puczko D., 2014, Ice Volume Estimates from Ground-Penetrating Radar Surveys, Wedel Jarlsberg Land. Glaciers, Svalbard, Arctic, Antarctic, and Alpine Research Journal, 46, 2, 394-406. Radjaee A., Cote C., 2019, GPR survey over INP placer claims, Groundtruth Exploration, Technical report.
Author Bios
Shawn Ryan
Co-owner of RyanWood Exploration Inc.,
Canada
sryan@ryanwoodexploration.com
Shawn Ryan has over 20 years of experience prospecting gold across the Yukon. A global leader in his field, his prospecting and specialization on advanced soil work led to the discovery of the millions of gold ounces.
Chad Cote
Operation Manager,
GroundTruth Exploration Inc
ccote@groundtruthexploration.com
Chad Cote graduated from the University of Victoria with a B.Sc in Physical Geography with a specialization in GIS in 2010. He has been a full time member of the GroundTruth team based in Dawson City since then. He has worked extensively in the field, with data and as a project manager for a wide range of geophysical and geochemical surveys including DC Resistivity-IP, Magnetic, VLF-EM, GPR, and soil/bedrock interface sampling,. He enjoys optimizing collection for maximum quality and efficiency, as well as combining results from a wide range of data sources to make informed interpretations.
Amir Radjaee
P.GeoSenior Geophysicist,
GroundTruth Exploration Inc.
aradjaee@groundtruthexploration.com
Amir Radjaee holds M.Sc. and Ph.D. degrees in Geophysics with research interests mainly focused on data processing and inversion modeling. With 15+ years of experience working as geophysicist in mineral exploration, geotechnical engineering, and environmental projects, he started working with Groundtruth Exploration on 2017. He is responsible in survey planning, data processing, inversion modeling and integrated interpretation of multi-disciplinary geoscience data for variety of projects. He is a member of the Association of Professional Engineers and Geoscientists of British Columbia since 2011.
Isaac Fage
President, GroundTruth Exploration Inc., Canada
109 Callison Way, Dawson, YT, Y0B 1G0, Canada
ifage@groundtruthexploration.com
Isaac Fage has worked in the Yukon mineral exploration industry continuously for more than 10 years. He began his career working for RyanWood Exploration Inc. from 2004 -2009 and graduated from the Centre of Geographic Sciences with an advanced diploma in Remote Sensing/GIS in 2007. Isaac was a co-founder of GroundTruth Exploration Inc. in 2010. He has built up a unique skill set that combines planning and execution of efficient field surveys with a strong GIS background for data management, analysis and mapping.
