Johannes B. Stoll / Thomas Kordes / Rolf Noellenburg
Abstract
Airborne Electromagnetic methods (AEM) are an efficient way to map geology and the implementation of innovative technologies for and are widely used in mineral exploration and environmental monitoring. Most EM methods currently used in mineral exploration are of the moving source type; i.e., the primary field source is moved simultaneously and in a fixed configuration with respect to the receiver.
In this paper we present an alternative configuration of AEM measurements, where a fixed transmitter is established on the ground and the receiver is flown on an unmanned aerial vehicle (UAV). This configuration is called the semi-airborne electromagnetic method.
The use of unmanned aircraft in airborne electromagnetics is new. Conventional measurement devices were too heavy to be lifted by small UAVs. Great efforts have been made in the last 10 years to make EM instruments light weight enough for use on small sized UAVs. In 2018, MGT GmbH presented an EM system that was miniaturized and optimized for deployment on a 20kg octocopter.
In this article, we describe an octocopter based semi-airborne electromagnetic data acquisition system and show the results of a field test in Northern Germany. This test affirmed that the UAV enabled semi-airborne electromagnetic method is very well suited to conduct geophysical surveys at prospect scale. The method is safer for the operators, cheaper with regard to initial and operational costs, and more effective in terms of site characterization. Future efforts will involve multiple source configurations and the implementation of innovative technologies for increasing the resolution of the conductivity structure at depth.
Introduction
Conventional AEM systems have been designed to employ a current-carrying loop or coil transported or towed by the aircraft as the source. In early days of the AEM development some systems used sources located on the ground (e.g. Bosschart&Seigel, 1966; Elliot, 1998). Grounded cables or loops were used and survey lines were flown perpendicular to these sources. This configuration is called semi-airborne “EM”, since it uses a source on ground and the receiver is transported by an aircraft. In 2001 Smith et al. (2001) reported about a comparison test aiming to investigate the advantages of semi-airborne EM over ground transient electromagnetics (TEM) and standard airborne TEM. The authors concluded that the semi-airborne EM concept combines the features and advantages of ground and airborne methods in terms of time efficiency and depth penetration. There are several groups working on the semi-airborne EM methodology. Working groups in Japan and China (Ito et al., 2014, Fubo et al., 2016, Liu et al., 2018) further developed this method and presented its applicability in the field. In 2016, a joint research project named DESMEX (Deep Electromagnetic Soundings for Mineral EXploration) in Germany was founded to develop a semi-airborne controlled-source electromagnetic exploration system for the exploration of deep mineral deposits up to 1 km
depth (Nittinger et al., 2017, Becken etal, 2020, Steuer et al., 2020). The complete measuring system consists of a 3-component induction coil system, a 3-component fluxgate magnetometer and a SQUID magnetometer. The sensors are installed in a bird and slung below a heavy lift helicopter. In order to reference the sensors to a Earth fixed reference frame the motion of the bird is recorded during flight. Laser gyros are used to accurately sense the motion of the bird and to compensate the sensor motion. The system and results from several field surveys are described by Becken et al. (2020) and Steuer (2020). Since the weight of the system amounts about 250kg, the DESMEX project uses a heavy lift helicopter to transport the measurement system.
In recent years, the reliability of drone technology and their portability has considerably increased with decreasing costs at the same time. Sensors are getting smaller and software is becoming more accessible. Regulations are changing fast. In most countries, the national aviation administrations and airspace authorities have released rules for small unmanned aircraft (UAS) operations including a pilot certification. The rules were eased to cover a broad spectrum of commercial uses for drones weighing less than 25 kg. The use of drones for geophysical measurements and the application for flight permissions became a formality and is regulated in most countries.
To our best knowledge, the first EM system on an unmanned aerial vehicle was described by Kipfinger (1998) from the US Geological Survey. He used a small size, light weight, low power VLF system. It was primarily designed for collecting VLF data during ground surveys over small grid areas. He modified it for installation on a Unmanned Aerial Vehicle (UAV), which was supplied by BAI AEROSYSTEMS, Inc.. Tests were flown in 1996 and 1997.
In collaboration with Aerialis GbR, MGT GmbH designed, developed and tested an octocopter. Based on previous test flights using a 75kg unmanned helicopter, an existing EM system from Metronix GmbH in Braunschweig Germany was miniaturized for the deployment on the octocopter and optimized with respect to payload capability and flight endurance. The total weight is far below 10kg and allows to use the system on small sized data acquisition system multicopters of similar payload capacity. Care was taken to minimize the EM interference from the multicopter and to reduce sensor movement during flight operations. Following sections will describe the concept of our octocopter based semi-airborne EM system.
Methodology of Airborne EM Using a Fixed Transmitter
In spite of their design diversity, all AEM systems share a similar principle of operation. The active systems use an artificial source to generate a primary, time varying magnetic field, which causes eddy currents to flow in the subsurface. A secondary electromagnetic field is generated by the currents in the ground and the field is measured by induction coils. The technique can be classified according to the type of transmitter and the receiver which measures the magnetic field. Most active AEM systems have been designed to employ a current-carrying loop towed by the aircraft. Early in the AEM method development, some systems used sources located on ground. For example, the airborne equivalent of TURAM used a non-grounded loop to generate a primary field. To achieve deep penetration a substantial separation between transmitter and receiver is desirable. One solution is to install the transmitter in one aircraft and the receiver in the other.
Here we follow a different approach. The UAV enabled semi-airborne electromagnetic method combines the benefits of a high power transmitter located on ground with UAV-borne EM receiver to map the resulting magnetic field. The ground source controls the source signal and applied frequency in a way that exceeds the depth penetration of standard airborne EM systems. Low frequencies and large transmitter-receiver offsets can be combined.
The Semi-Airborne Electromagnetics method is a frequency-domain electromagnetic sounding technique which uses a fixed grounded dipole or horizontal loop as an artificial signal source. The source provides a stable, dependable signal, resulting in higher-precision and more economical measurements usually obtained with natural-source measurements in the same spectral bands. Typically, measurements are made within the 1Hz to 10kHz frequency band. The depth of investigation is a function of the separation distance between the transmitter dipole and the receiver. The lateral resolution is controlled by the electric dipole length, which normally is between 100-1000m.
For separations greater than 4δ, where δ is the skin depth of the EM field for a given frequency, the depth of investigation corresponds roughly to . The region electrically far from the dipole is known as the “far-field” zone or “plane-wave”-zone, characterized by large induction numbers. The induction number is a dimensionless parameter and characterizes the electromagnetic induction response. For a 1D layered earth model, the induction number is given by the source-receiver separation. The separation is much larger than the skin depth and the depth of penetration is independent of array geometry. For the given frequency band and typical electrical conductivities of the uppermost part of the Earth’s crust, the depth of investigation is limited to 2-3km.
The region near the transmitting dipole is characterized by small induction numbers, where the separation is much smaller than the skin depth. The sounding depth and the resistivity measured there are a function of array geometry and frequency. The region between these zones is called the “transition” zone, where there is moderate wave curvature.
Along a flight profile the drone approaches and constantly moves away from the electric source and changes from the near zone to the transition zone and the far zone with respect to separation and frequency used.
In the frequency domain controlled-source electromagnetic (CSEM) method, an electromagnetic dipole is used to create a source field that is measured at receivers placed on an unmanned aerial vehicle (UAV). This source dipole field couples with surrounding materials and the measured field is treated as a linear convolution of the source with an attenuative, diffusive earth (Ward&Hohmann 1987). The frequency response of the Earth transfer function (TF) varies according to conductivity, source–receiver range and a variety of other factors, with the result that the CSEM method is sensitive to changes in the electrical conductivity at depth. Thus the CSEM method has become an important geophysical sounding and mapping method in mineral exploration and hydrocarbon exploration. Because the peak frequency sensitivity of an exploration target is not well known a priori, it is common to transmit a source waveform, which allows for simultaneous broadcast of multiple frequencies.
The classic example of such a waveform is the square wave, which provides a bunch of frequencies at the odd harmonics of the fundamental transmission frequency. However, the amplitude of its harmonics falls off as 1/n, where n is the harmonic number. The fields attenuate exponentially as a function of range and frequency, many of the square wave’s harmonics fall below the noise level at useful ranges.
The signal-to-noise ratio (SNR) of the measured CSEM signal is directly related to the source dipole moment (SDM) of the transmitter. Existing transmitters output up to several decades of amps. Transmitter dipole lengths up to 1000m are common but because of the increasing complexity of logistics longer dipoles are impractical.
The source signal is a time series of electric current generated by the transmitter. In CSEM, it is common practice to apply a square-wave (Figure 1a). The source signal as well as the Earth’s response is a line spectrum. Figure 1 shows an example of the square wave in the time domain and its amplitude spectrum (Figure 1b). The fundamental wave and a large number of harmonics are generated up to 10kHz and provide a series of evaluation frequencies that set up the transfer function.
The time series of the response is shown in Figure 1c and its amplitude spectrum in Figure 1d. We emphazise here that the induction coils used in this test survey output the magnetic field but not the first derivative dH/dt.
It is generally known that in the near field approximation, the primary and secondary fields cannot be separated. Further shall be emphazised that the magnetic field is not sensitive for the earth conductivity in the near field of the transmitter. This suggests to use a different source signal with 50% duty cycle, that allows to pick the EM signal in the time domain during off time of the electric source.
The Multicopter-Based Semi-Airborne EM System
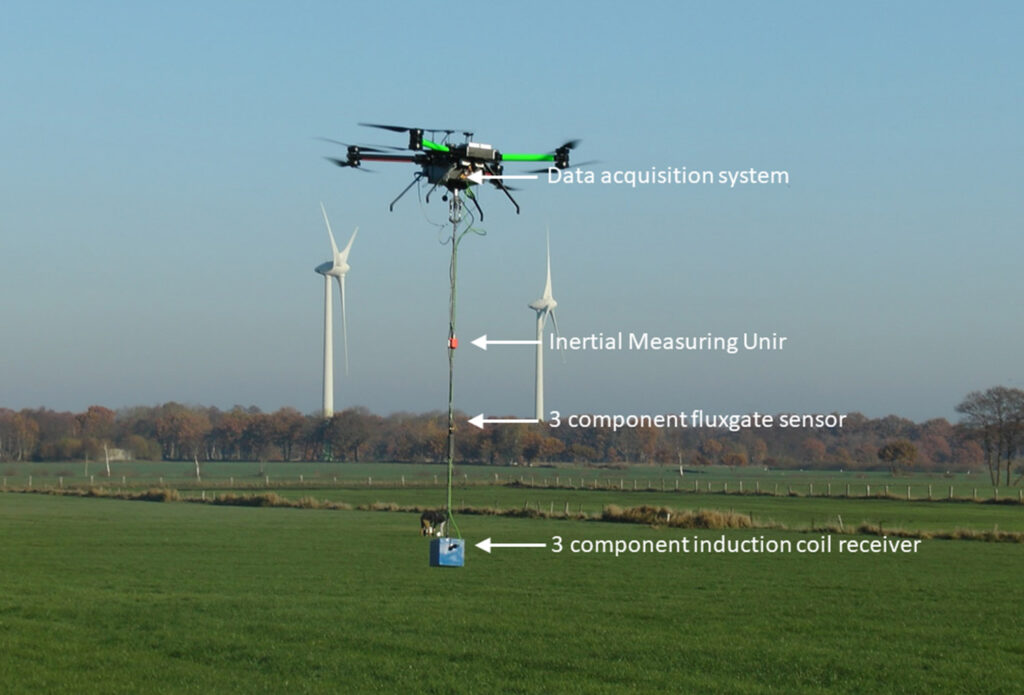
We developed an octocopter (8 engines) specifically designed and manufactured by Aerialis GbR in Bremerhaven/Germany. The specifications are listed in Table 1. Figure 2 shows the complete system, consisting of the octocopter with the GPS receiver on top of the drone and the 3-component induction coil sensor contained in a light weight box. The sensor is mounted on a bar and slung 2.0m below the octocopter. Ancillary sensors, fluxgate and inertial measuring unit, are also mounted on the vertical bar. This novel system combines high-moment horizontal electric dipole transmitter on the ground with low-noise three-axis induction coil magnetometers, a three-axis fluxgate magnetometer and a laser gyro inertial measurement unit integrated within a helicopter-towed airborne platform.
| UAV type | Octocopter X825 (8 electric motors), coaxial configuration |
| autopilot | The multicopter can be operated in various modes: a) manual mode, b) GPS Position Hold, c) autonomous Navigation. Terrain Following Mode, Low Voltage Protection, Homing function & Auto Landing |
| max speed | Vertical: -2 – 5m/s Horizontal: 15m/s |
| empty weight | 7.1kg (2 batteries 4.4kg) |
| maximum payload | 9.1 kg (@ 25,0 kg MTOW) |
| endurance | 35 min @ 6kg payload |
| temperature, humidity | -5°C to +50°C, 0% – 90% RH (non condensing) |
| wind | < 8 m/s (17,9 mph / 28,8 km/h) |
| distance | data link range: ≤ 1 km (@ 2.4 GHz, visual line-of-sight) |
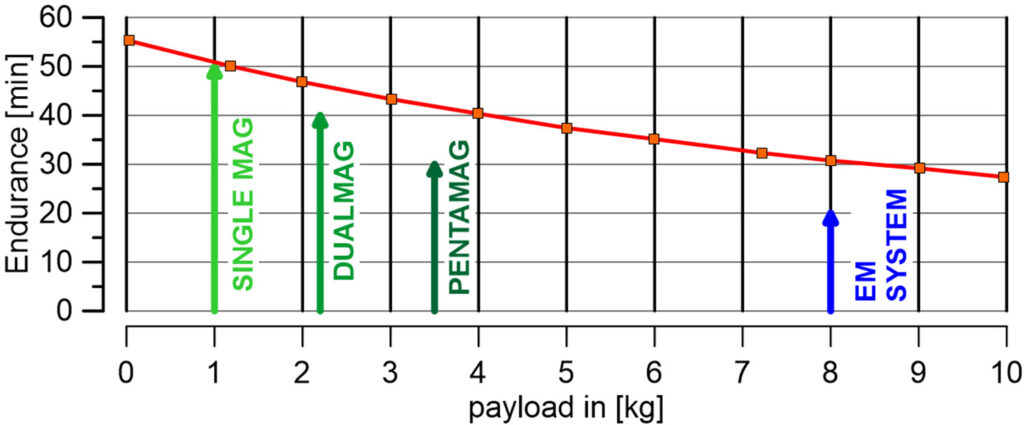
The endurance is an important issue in commercial applications. It depends on the power consumption of the propulsion system, and the flight time is limited due to the limited energy storage capacity. In addition to the propulsion system, the drag and weight of the multicopter strongly affect the flight time. Figure 3 shows the endurance of the octocopter as a function of the payload derived from a synthetic multicopter model for given components (battery specifications and discharge, power consumption, motors and propellers).
Results of a Field Test in Northern Germany
In this section, we present the results of a semi-airborne test carried out on flat grassland in Northern Germany. We briefly describe the field setup, the steps to estimate the transfer function and, finally, present a numerical model that interprets the transfer function at one measuring point.
FIELD SETUP AND DESCRIPTION OF FLIGHT OPERATIONS
The semi-airborne EM test was carried out on November 15 and 16, 2018. The field set up involved installing a long electric grounded wire several hundred meters long. The test site is about 10km east of Bremerhaven in Northern Germany. Figure 4 shows the position of the electrodes, the direction of the wire and the flight lines. On the day of flight, the ambient temperature was around 5°C. The weather was misty but there was almost no wind.
A total of four flights were carried out. Each flight consisted of four lines flown at a speed of 2 m/s. The regular lines were directed east-west. A control flight was done in north-south direction. The average flight altitude was 25m above ground level. The lines are 950m long. The line spacing is 50m.
The electric wire was laid out and connected to a transmitter. In order to allow large separations between the transmitter and the receiver we used a GGT30 30kW generator from Zonge Engineering. The contact impedance of the current electrodes buried in the soil was optimized using metal meshes and metal stakes. The maximum output voltage of the generator is 1kV. Due to low contact impedance prevailing at this site current amplitudes up to 25 amps were realized. However to avoid sensor saturation during the crossover flight of the line source, the current strength was reduced to less than 10 amps. The duty cycle was set to 100% and the fundamental frequency was set at 10 Hz for two flights and 100 Hz for the other two flights.. The system was operated in the frequency domain. The time series of the current is synchronized via GPS time stamp with the transmitter which permits subsequent stacking and windowing of the data. The induction coils are connected to a three-channel receiver. An Inertial Measuring Unit (IMU) senses the orientation (compass) of the coil triple against the Earth’s reference frame to allow subsequent correction of sensor motion.
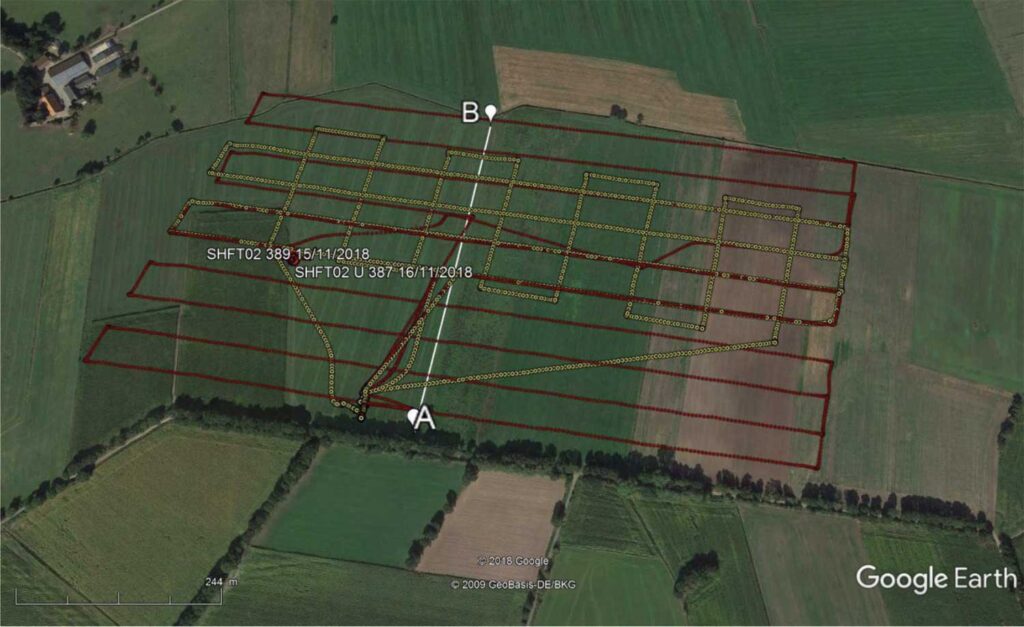
About 250 m west of the electric dipole an EM ground station was installed to record the time series of the three components Hx, Hy, and Hz at a fixed point on ground. It allows comparison of the response of the UAV borne EM system with the readings at this station on ground, while the octocopter flies over it. A second EM unit was installed to record the electric current during flight operations. All measuring systems are synchronized with GPS accuracy. The flight speed was 2m/s for all flights. The multicopter was operated in autonomous mode. Three flights were required, each 20 min long, to cover the 950m X 500m large area.
A current probe was clamped around the electric wire to record the time series of the current. It is a simple measurement of the current, that is transmitted, without the need to make physical contact with it. The device allows measurements of the electric current ranging from 50mA up to 100A over a frequency range from DC up to 100kHz. The current recordings are needed as a reference to normalize the magnetic field measured with the receiver coils to the current. The time series of electric current and the magnetic field require highly accurate synchronization. The data acquisitions systems being used in this survey, provide an accuracy of the synchronization better than 50ns.
Figure 5 shows the time series of the three magnetic components along one flight line. The graphs show the envelope of the square wave signal along the flight line during the cross over flight over the transmitter. The maximum of the magnetic field is clearly visible in the Hx component. The Hz component shows a zero crossing and a sign change over the transmitter cable.
DATA PROCESSING AND ESTIMATION OF THE TRANSFER FUNCTION
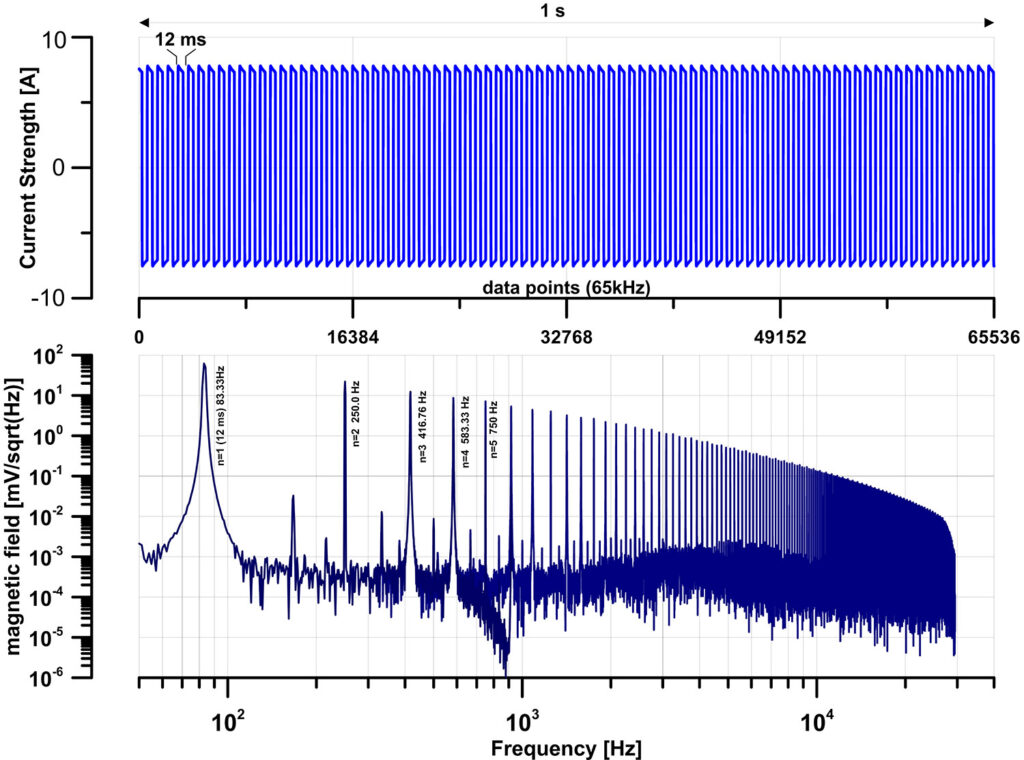
The time series of the current and the magnetic fields are analyzed in the frequency domain. In this section we analyse flight 4 of November 16. Figure 6 shows a time section of the current measurements and the amplitude spectrum. The pulse length was 12ms, which corresponds to the fundamental frequency 83.33Hz. The sample rate was 65536Hz, and harmonics were generated up to 30kHz. The square wave contains components of odd-integer harmonic frequencies of the form .
The processing procedure involves the analysis of the data in the frequency domain to estimate the transfer function for selected evaluation frequencies. In essence, the transfer function between the readings of the vertical magnetic field component Bz and of the electric current signal is analyzed.
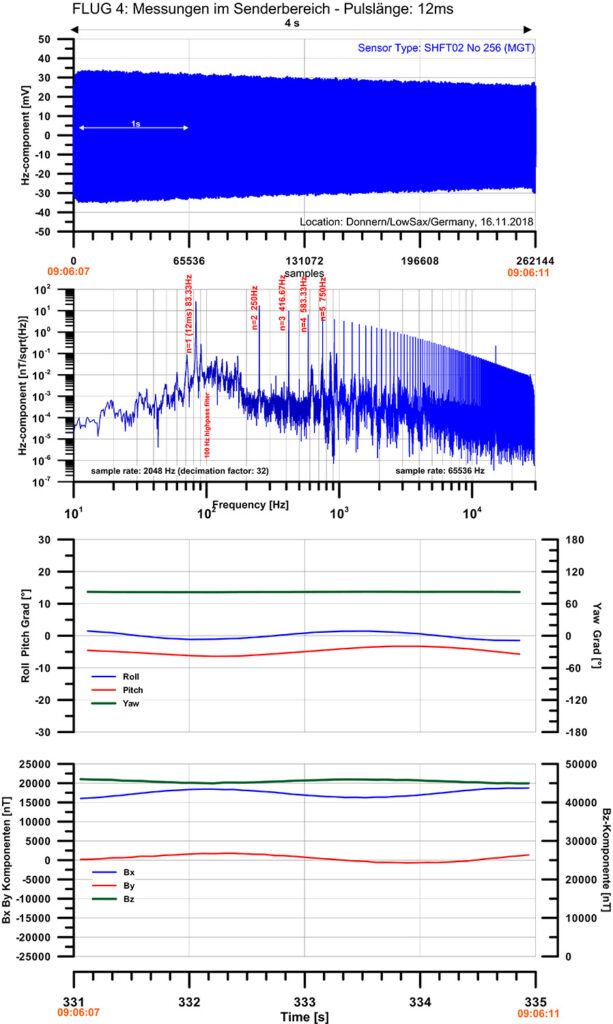
Transfer FunctionFigure 7 shows the time series of the vertical component Bz for a time window of 4s and the amplitude spectrum for this time interval in the two upper panels. The data interval was recorded on flight 4 and is located about 100m west of the transmitter cable. The readings depict the decrease of the amplitude of the magnetic field while moving away from the transmitter.
The two lower panels show the Euler angles sensed by the inertial measuring unit and the horizontal and vertical magnetic field obtained from the 3-component fluxgate magnetometer. Fluxgate magnetometers are known to be extremely sensitive to movement. The readings indicate only little movement of the EM receiver during flight. The amplitude is small (<5°) and the period is almost monochromatic at about 3s.
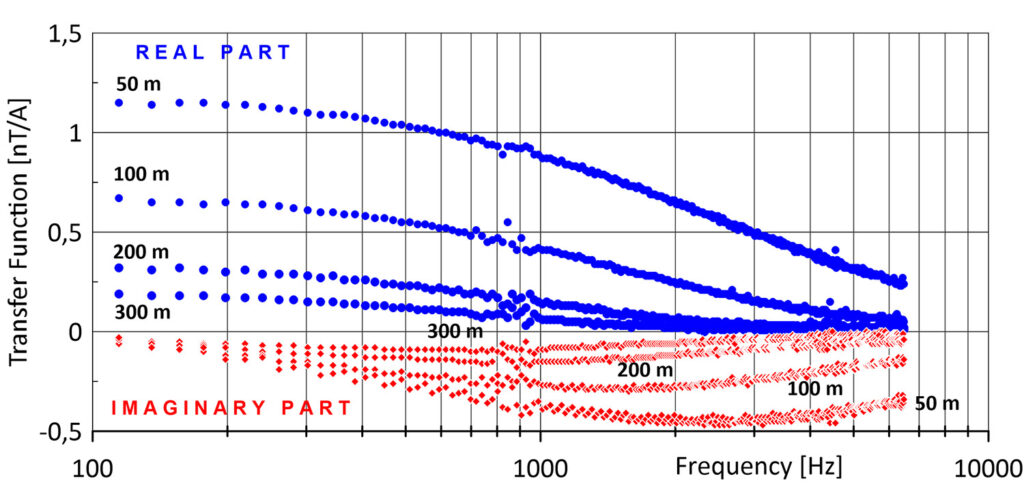
The transfer function was evaluated for all harmonics of the amplitude spectrum. It is shown in Figure 8 for four different separations from the electric dipole. The transfer function is a complex quantity. It is estimated in the frequency range between 100Hz and 8kHz and comprise of 300 frequencies. The real part (blue dots) is constantly rising and approaches a finite value in the DC limit. The imaginary part (red dots) reaches a minimum value and decrease to zero in the DC limit. At low frequencies the transfer function contains a real part only and is in-phase with the transmitter signal.
Each measurement point on the profile corresponds to a sounding point at which the electrical conductivity can be determined as a function of distance and frequency. In the last section a conductivity model is derived at a distance of 325m from the transmitter dipole. The result of the numerical modeling is shown in Figure 10.
Numerical Modelling
The AC/DC Module of Comsol Multiphysics® is a simulation software for solving low-frequency, quasistatic electromagnetic and electromechanical problems. In combination with the optimization module it can be used to solve inverse problems.
In particular, we are aiming to determine the values of a set of parameters and calculate synthetic data to fit the observed data. Here we give an example how this module can be applied to fit the transfer function of the semi-airborne EM measurements estimated for a single point and using a simple 3-layer model.
The geology of the test area is known to consist of tertiary and quaternary sediments. This suggests that a layered earth is an appropriate geologic model.
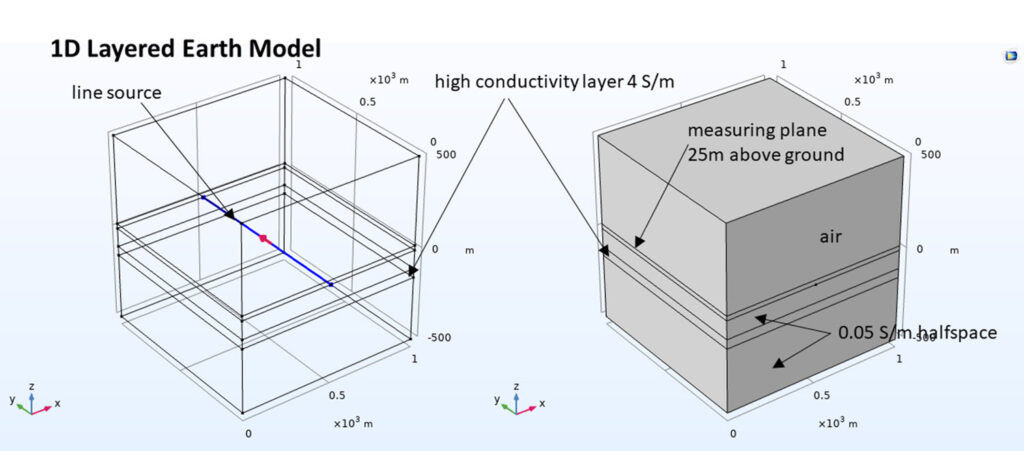
The parameters of the 3-layer model are defined in Figure 9. The model is a 1kmX1kmX1km large cubic body. In essence it consists of one highly conductive layer of 4 S/m, sandwiched between two layer of a much lower conductivity of 0.02 S/m. The thickness of the uppermost layer is set at 100m allowed to vary during the inversion process. The thickness of the conductive layer is 50m. An infinite electric line source is located in the center of the ground surface plane. The ground surface is covered by an airspace of 500m thickness. 25m above the ground level a measuring plan is defined which corresponds to the average flight altitude. The transfer function was estimated for a point 325m away from the transmitter cable. The transfer function is shown in Figure 10.
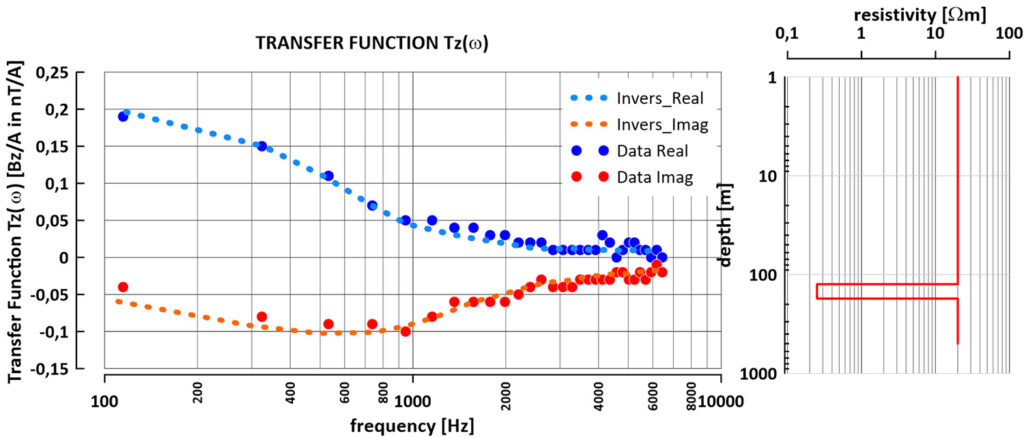
Figure 10 depicts the results of the optimization process. To keep the problem simple, only the depth range was varied between 50 and 350m. The electrical conductivity was set to 1 S/m. The layer thickness was also fixed to 50m. This corresponds to a conductance of 50 Siemens.
Using trial and error method an initial model was chosen from a chart of synthetic transfer functions. Only 30 frequencies out of 300 were used in this inversion process. This chart of model curves was created to pre-select one transfer function as the initial input model which is close to the observed transfer function. In the final step, the Marquardt-Levenberg algorithm was applied to adjust the synthetic transfer function. The final result is shown in Figure 10.
The test area is situated in the North West German Basin, which is known for its salt tectonics of Permian salt diapirs. The test area is located about 2 km south of a salt diapir named “Bramel”. It is covered by tertiary and quaternary sediments. The underlying salt dome is highly resistive but becomes dissolved when in contact with fresh water. The brines are highly conductive and the salinity causes a high conductivity zone in deeper aquifers.
Conclusion
In 2018 first UAV enabled semi-airborne electromagnetic measurements were performed on a test site in Northern Germany.
Four lines, each 1 km long were flown per flight. The flight time was less than 20min. A daily production rate of 3-5 square kilometers is feasible. The UAV based semi-airborne EM system is most suitable for projects on prospect size.
The logistics of a UAV semi-airborne EM survey is minimal when compared to 2 pilots and 1 geophysicist are required to perform the survey. The daily production rate is between 2-5 square kilometers. However, an additional ground team is necessary to set up the transmitter on ground.
The suspension of the EM receiver below the octocopter causes only slight movements of the induction coils and is far below the range of frequencies used in this survey.
During survey operations, measurements change from near-field to the transition zone then to the far-field response. Even for a simple layered model geometry, sophisticated modeling capabilities are needed to take into account the response due to changes in receiver transmitter geometry.
The UAV-based semi-airborne method has great potential to significantly improve the resolution of highly conductive structures, this is particularly true if multiple transmitter sources are used.
UAV based semi-airborne EM fills the gap between ground based EM measurements and conventional manned airborne EM methodologies.
Acknowledgements
We are grateful to all helpers in the field and to the technical staff, who contributed to the test survey and to the technical developments in November 2018. This first UAV based semi-airborne test survey was only possible with the support of many colleagues. In particular, I would like to thank Ulrich Matzander from Metronix GmbH for his great commitment in preparing the test project. We are grateful to Bernhard Friedrichs and Martin Wilde (Metronix GmbH) for their continued interest and the provision of measuring devices.
I also like to thank my colleagues from the Institute for Geophysics, University of Münster, Michael Becken, Julian Wessel, Alexander Weyer, Yannik Polkowski, Philipp Kotowski for their help in setting up the measuring devices and for recording the electrical current. I would also like to thank Rainer Bergers, Andreas Busse and Bülent Tezkan, Pritam Yogeshwar (Institute of Geophysics, Univ. Cologne), as well as Thomas Günther, Mike Müller-Petke, and Robert Meyer from the Leibniz Center for Applied Geophysics, Hanover, for providing the two power sources.
References
Baldschuh,R., Binot,F., Fleig, S., und Kockel, F., 2001. Geotektonischer Atlas von Nordwestdeutschland und dem deutschen Nordsee-Sektor. Geolog. Jahrbuch A 153 S 95 Stuttgart (Schweizerbart). Aus: Landesamt für Bergbau, Energie und Geologie, Referat Bergbau und Energie. Referat Digitale Kartographie, 3D Modellierung
M. Becken, , C. G. Nittinger, , M. Smirnova, , A. Steuer, , T. Martin, , H. Petersen, , U. Meyer, , W. Mörbe, , P. Yogeshwar, , B. Tezkan, , U. Matzander, , B. Friedrichs, , R. Rochlitz, , T. Günther, , M. Schiffler, , and R. Stolz. 2020. DESMEX: A novel system development for semi-airborne electromagnetic exploration. (accepted for publication)
Bosschart, A.R.& H.O.Seigel, 1966. Some Aspects of the Turam Electromagnetic Method. Transactions, Volume LXIX, 1966, pp. 156-1 61
COMSOL MULTIPHYSICS: https://www.comsol.com/
Elliott, P., 1998, The principles and practice of FLAIRTEM: Expl Geophys, 29, 58–60.
L. Fubo, L., Huang, L. Lihua, L. Jutao, G. Zhi, Z. Qimao & G. Fang. (2016). A New Semi-airborne Transient Electromagnetic System and Application of Detecting Underground Conductor in East Ujimqin Banner, China. 10.2991/iceeg-16.2016.113.
H. Ito, H. Kaieda, T. Mogi, A. Jomori. 2014. Grounded electrical-source airborne transient electromagnetics (GREATEM) survey of Aso Volcano, Japan. Exploration Geophysics 45(1) April 2014, DOI: 10.1071/EG12074
R.P. Kipfinger Jr. 1998. Unmanned airborne vehicle (UAV): Flight testing and evaluation of two channel E-field very low frequency (VLF) instrument. USGS, DOE/OR/22398-TI
F. Liu, Z. Qimao, G. Zhi, P. Yuxi, L. Yang. G. Fang. (2018). Application of grounded electrical source airborne TEM system in Changyi BIF deposit, Jiaodong Peninsula of eastern China. Annals of Geophysics. 61. 10.4401/ag-7457.
C. Nittinger, M. Cherevatova, M. Becken, A. Steuer, R. Rochlitz, DESMEX Working Group Airborne induction coil and fluxgate measurements above a grounded electric dipole, 23rd Electromagnetic Induction Workshop (EMIW2016), 14.-20.08.2016 Chiang Mai, Thailand.
R.S. Smith, A.P. Annan, & P.D. McGowan, 2001. A comparison of data from airborne, semi-airborne, and ground electromagnetic systems. Geophys, 66, 5; pp. 1379–1385.
Steuer, A., M. Smirnova, M Becken, M Schiffler, Th. Günther, R. Rochlitz, P Yogeshwar, W Mörbe, B. Siemon, S. Costabel, B. Preugschat, M. Ibst von Seht, L.S. Zampa, Franz Müll. 2020. Comparison of novel semi-airborne electromagnetic data with multi-scale geophysical, petrophysical and geological data from Schleiz, Germany. J. Appl. Geophys 182 (2020) 104172, https://doi.org/10.1016/j.jappgeo.2020.104172
Ward S.H. and Hohmann, G.W., 1987. Investigations in Geophysics Electromagnetic Methods in Applied Geophysics: Volume 1, Theory Editor Misac N. Nabighian, Society of Exploration Geophysicists

